When troubleshooting a high-impact software failure in a group, you have to be ready for shifts in tenor. One moment there’s a frenzy of coordination, and the next: absolute silence.
Silence is natural and often useful. But to be an effective incident commander – whose job is to keep the problem-solving effort moving forward – you must develop a keen ear for silence.
Silence can mean different things to different people in different situations. In this post, I’ll present a few incident scenarios and explore the role of the incident commander in breaking (or simply abiding in) dead air.
“Any minute now”
Sylvain (from the [s]upport team) has spun up an incident call after getting 3 consecutive reports of broken CSS on the production app. You are the incident commander, and Oscar (from [o]perations) has immediately volunteered to be the primary investigator. Deanna and Deepak (software [d]evs) are also on the call.
There’s some ambiguity about whether the CSS issue merits a status page post. Nobody has found a “smoking gun” showing that, for example, 404 errors are happening at an elevated rate. And now Oscar announces, “I’m seeing some log entries from the web server that look a little weird. I’m gonna look at those.” This is the beginning of a 5-minute silence.
During the silence, Deanna, Deepak, and Sylvain are all waiting, hoping that these log entries that Oscar just noticed turn out to be the smoking gun. They’re putting their eggs in the basket of Oscar’s intuition. Hopefully he’s seen this issue before, and any minute now he’ll say “Okay, I’m pushing a fix.”
The problem is, it’s equally possible that Oscar has latched onto a red herring (some salient but ultimately irrelevant observation). If there were a conversation in place of silence, then Deanna could be researching the error message, or Deepak might be able to immediately rule out the error as a cause of the broken CSS, or Sylvain could provide a detail from one of the customer tickets that would narrow the scope of the investigation. But instead, everybody’s twiddling their thumbs hoping for Oscar to emerge with a fix.
An incident commander is responsible for keeping the whole problem-solving effort moving forward. So it’s incumbent on you to interrupt this silence.
Try drawing more information out of Oscar:
“Oscar, do you mind sharing your screen so Deepak and Deanna can see the weird log messages too?”
“What’s the error message, Oscar? Can you send a link to a log search?”
“Do we know when these log events started? Does that line up with when we started receiving these support tickets, Sylvain?”
The more we audit each other’s thought processes, the more effective we are at joint problem-solving. An IC must make this happen.
“LGTM”
Sylvain has spun up an incident call after getting 3 consecutive reports of broken CSS on the production website. You are the incident commander.
Oscar has checked a bunch of graph dashboards and hasn’t found any evidence of a widespread system failure. He’s said as much. Now there’s relative silence on the call for five minutes.
Deanna and Deepak are basically in agreement with Oscar: there’s no evidence of a system health issue. To them, and to Oscar, it’s not really clear how strong a signal Sylvain has. It could just be a coincidence that these three reports all arrived in a row. The engineers on the call are thinking, I guess we’ll keep poking at this, but we’re not even sure this is a real issue. We need more information.
Sylvain, on the other hand, is positive that something is wrong. Getting 3 support tickets in a row about the same behavior is very strong evidence to him. He’s presented his information to the investigators, and now he’s thinking, Okay, they say it’s not a widespread issue. But I’m sure Oscar is getting to the bottom of it.
There’s been a common ground breakdown, and as a result, a silence that becomes more and more frustrating.
As incident commander, you should focus the group’s attention on observable symptoms by asking questions like:
“Has anybody been able to reproduce these broken page-loads in a browser? Preferably with Dev Tools turned on?”
“Sylvain, I don’t have an intuition for support ticket frequencies. How unusual is it to get 3 reports of the same thing right in a row like this?”
“Can we find, in the access logs, just one example of a stylesheet request that returned a non-200 response?”
“Let’s see here…”
Sylvain has spun up an incident call after getting 3 consecutive reports of broken CSS on the production website. You are the incident commander. The investigation has been going along, and Oscar is chasing down a hunch that a particular error message from the web server is related to the stylesheet failures. Deanna is digging into some code to help validate Oscar’s hunch.
Deepak joins the call. There’s no chatter, as everyone is waiting for Oscar and Deanna to come up with their findings. So Deepak reads the chat scrollback, which takes him about 5 minutes. It’s not until the end of those 5 minutes that Deepak understands what Oscar and Deanna are working on.
As it happens, Deepak has seen the web server error message in question before. He knows what it means, and he can explain why it’s a red herring. But for the 5 minutes it takes him to get up to speed by reading the chat scrollback, silence persists.
In order to keep a problem-solving effort moving forward, an incident commander should ensure that every new participant gets up-to-date knowledge of what the group is doing and why. At small scale (less than, say, 10 people on the call), you can do this verbally. For example, you could say to Deepak when he joins the call, “Hi Deepak. Right now, Oscar and Deanna are investigating a web server error message that might be related to failed stylesheet loads. You can see the error message in the chat.”
When there are more than 10 people, the verbal approach stops working. It becomes necessary to have a shared document of some sort, continuously updated by a “scribe.” It’s not sufficient for this document to be merely a timeline of events: it must highlight the current state of the joint diagnostic effort. I recommend clinical troubleshooting for this.
“I need 5 minutes”
When incident response is going right, everybody understands what’s being done by whom, and why. As information comes to light and our strategies evolve, it takes more or less constant communication to maintain this state. That’s why silence on an incident call is so often an indicator of trouble: when there’s silence, communication isn’t happening.
There is, however, a healthy kind of dead air.
Sometimes an investigator needs to go silent for a while to chase down a hunch, or collect some data, or research some question. As long as such a silence is negotiated in advance, with a specific time to reconvene, it can serve a crucial purpose. I call this functional dead air.
It’s the job of the incident commander to ensure that every nontrivial silence is functional. First, communicate what’s being done by whom, and why. Only then, do it.
I offer incident response training for engineers. Get in touch!
Over my career as an SRE, I’ve diagnosed thousands of production issues. When I’m lucky, I have enough information at hand, and enough expertise in the systems involved, to get to the bottom of the problem on my own. But very often I need to bring together a team.
Troubleshooting with a team unleashes enormous power. Problems that would have taken me days to solve as an individual might take only hours or minutes, thanks to the benefit of pooled knowledge.
However, collaborative troubleshooting also comes with dangers. Time and again, I’ve seen groups struggle to make progress on an investigation due to miscommunication, misalignment, and confusion. Among other difficulties, the fundamental common ground breakdown can have especially heinous consequences in this context.
Over the years, I’ve developed a reliable method for harnessing the diagnostic power of groups. My approach is derived from a different field in which groups of experts with various levels of context need to reason together about problems in a complex, dynamic system: medicine.
I call this method clinical troubleshooting.
The clinical troubleshooting process
Although clinical troubleshooting can be useful in solo troubleshooting, it really shines as a group activity. It’s a lightweight structure that always adds value. I recommend reaching for clinical troubleshooting as soon as you need to involve another person in any “why” question about an unexpected behavior of your system.
Step 0: Get a group together
Before you start, gather the people you’ll be troubleshooting with. Any synchronous communication channel can work for this: Slack, Zoom, a meeting room; you name it.
You don’t need a big group. In fact, a small group is best. What matters most is that you bring together diverse perspectives. If you’re a backend engineer, try to pull in a network engineer and a frontend engineer, or a support agent and a sysadmin. Cast a wide net.
Once you have an initial group, share a blank Google doc with everyone.
Step 1: Identify symptoms
Add a Symptoms header to the doc.
You’re the one bringing the issue, so you must have some observations already. Write those down in a numbered list.
It’s important that it be a numbered list rather than a bulleted list. As the troubleshooting process goes on, you’re going to want to refer to individual symptoms (and, later, hypotheses and actions). If each symptom has a number and the number never changes, this is a lot easier.
Ask your collaborators to list symptoms, too. They may have observed some other facet of the problem, or they may think to look at a graph that you don’t know about.
Here’s what an initial symptom list might look like:
Symptoms
About 5 times a day, the Storage API sends a spike of 503 responses. Each spike lasts about 500 milliseconds and includes between 200 and 1000 responses (about 0.1 to 0.5% of all responses sent during the interval)
Outside of these spikes, the Storage API has not sent any 503 responses at all in the last 14 days.
The failing requests have short durations, around the same as those of normal requests (mostly under 100 milliseconds).
(In this and subsequent examples, don’t worry about understanding the exact technical situation. Clinical troubleshooting can be used on problems in any part of any tech stack.)
All the symptoms on the list should be precise and objective. In other words, if a statement is quantifiable, quantify it. Don’t make suppositions yet about why these phenomena have been observed. That comes next.
Once you’re all on the same page about what problem you’re investigating, the initial symptom list is done.
Step 2: Brainstorm hypotheses
Add a Hypotheses header to the doc. Invite your colleagues to join you in suggesting hypotheses that might explain the symptoms.
Let the ideas flow, and write them all down. This is where having a diverse set of perspectives in the room really pays off. Your co-investigators will think of hypotheses that would never have occurred to you, and vice versa. The more of these you come up with, the more likely the actual explanation will be on the list.
A hypothesis can’t be just anything, though. A hypothesis must
explain (at least some of) the symptoms,
accord with all known facts, and
be falsifiable (that is: if it were false, we’d be able somehow to prove it false).
For example, given the symptoms above, “requests to the storage API are getting queued up behind a long-running query” would not be a sound hypothesis, since it’s inconsistent with Symptom 3. If requests were queued up, we’d expect them to take longer before failing.
After some discussion, your hypothesis list might look like this:
Hypotheses
A particular request causes an out-of-memory (OOM) event on a storage server, and all in-flight requests to that server get killed.
A network hiccup causes connections between the load balancer and a storage server to be severed.
Requests to the storage API are getting queued up behind a long-running query
Discarded because inconsistent with Symptom 3
A network hiccup causes connections between storage API servers and a persistence layer node to be severed.
Again, use a numbered list. If a hypothesis is ruled out or deemed irrelevant, don’t delete it: you don’t want the list numbering to change. Instead, mark it in some with formatting. I use strikethrough. Gray works too.
Step 3: Select actions
Add an Actions header.
In a new numbered list, choose one or two actions that will advance the troubleshooting effort. Usually, you should pick actions that will rule out, or “falsify,” one or more of the hypotheses on the table.
To rule out Hypothesis 2 above, for instance, you could review the logs for one of the error spikes and check whether all the affected requests were associated with the same load balancer or the same storage server. If the requests are distributed across your infrastructure, then Hypothesis 2 is ruled out (and Hypothesis 1 as well, for that matter!).
When you agree upon actions, it’s best to assign them to individuals. Sometimes an action can be taken right away, and other times it’ll take a while and the group will have to reconvene later. But ownership should never be unclear.
Ruling out hypotheses the only purpose of actions in clinical troubleshooting. You can also assign actions that expand the group’s understanding of the problem, in order to generate new symptoms and new hypotheses. These actions can be things like, “Read the documentation on system X‘s network configuration,” or “Search for blog posts about error message E.” As long as there’s at least one hypothesis in the running, though, there ought to be at least one action in flight that could falsify it. That’s one of the ways clinical troubleshooting ensures constant progress.
Steps 4 through N: Cycle back through
When actions are completed, you get more information for the symptom list. More symptoms suggest new hypotheses. New hypotheses imply further actions. Just keep going through the cycle until you’re satisfied.
Sometimes you won’t be satisfied until you have a definitive diagnosis: a solid explanation for all the symptoms that’s been proven right. Other times, you’ll be satisfied as soon as you take an action that makes the problem go away, even if there’s still uncertainty about what exactly was going on.
In any case, clinical troubleshooting will reliably get you to the solution.
Keep things moving forward
In the absence of structure, collaborative diagnosis can stall out. Or worse, go backward.
With clinical troubleshooting, there’s always a next step forward. Teams that practice this method will consistently get to the bottom of technical mysteries, even when strapped for data or under intense pressure. And over time, as this scientific way of thinking becomes a habit, and then a culture, we come to understand the behavior of our system that much better.
I can teach your team how to do this. Get in touch.
In SaaS, when we’re hiring engineers, we usually imagine that their time will mostly be spent building things. So we never forget to interview for skills at building stuff. Sometimes we ask candidates to write code on the fly. Other times we ask them to whiteboard out a sensible architecture for a new software product. We ask them to tell us a story about a piece of software or infrastructure that they built. All this focus on building things ensures that we’ll end up hiring a candidate who can build things.
And yet, when you work in SRE or operations, or really any backend engineering role with an on-call rotation, troubleshooting is one of your core responsibilities. Some months, you’ll spend far more time troubleshooting than building. So shouldn’t your troubleshooting skills be evaluated during the interview process?
When I talk about interviewing candidates for troubleshooting skills, I mean answering questions like:
Can they distinguish relevant from irrelevant facts?
Do they seek to answer specific questions?
Will they keep an open mind about the cause of a problem, rather than jumping to a conclusion?
Are they able to express their thought process to a colleague?
When they hit a dead end, will they get discouraged? Or will they calmly seek out a different approach?
Do they have a strategy?
Several times throughout my SRE career, I’ve put together interview processes to screen for these skills. The most effective method I’ve found is to create a sort of interactive role-playing game in which the candidate tries to solve a tricky bug in a complex system.
In this post, I’ll show how I went about creating one of these interview questions and how I evaluated the performance of candidates. I hope you’ll be able to copy my approach and produce your own such interview scenario (please reach out if you try this!). If you do, you’ll raise the bar for diagnostic skills on your team, and your operations will run that much more smoothly.
The incident
Around a year into my stint at $lastJob, I was tapped to organize an ongoing investigation into weird, customer-facing, nondeterministic-seeming API timeouts.
The API in question was essentially a private software package registry. But the authentication logic that made the registry private was not implemented in the registry itself. Instead, calls to this registry were proxied by a broader, public-facing API, which handled auth/auth considerations. Here’s a diagram of the whole situation:
Timeouts would occur seemingly at random, at a rate of about 1 timeout per 10,000 requests. The content of the request didn’t matter: any given request for the private registry might hang for 10 seconds and then fail. But if you immediately retried the same request, it would succeed.
I led a team of 4 engineers in a diagnostic effort, and after almost 3 weeks of methodical investigation, we finally got to the bottom of these timeouts. Along the way, we stumbled into several dead-ends and chased a fair number of red herrings.
I’ll spare you most of the details, but it’s important to note the existence of all these dead-ends. They later served as a signal that this problem was sufficiently complex and counterintuitive to give interview candidates a real workout. When you go searching for an incident to turn into a troubleshooting skills interview, look for investigations with lots of dead-ends.
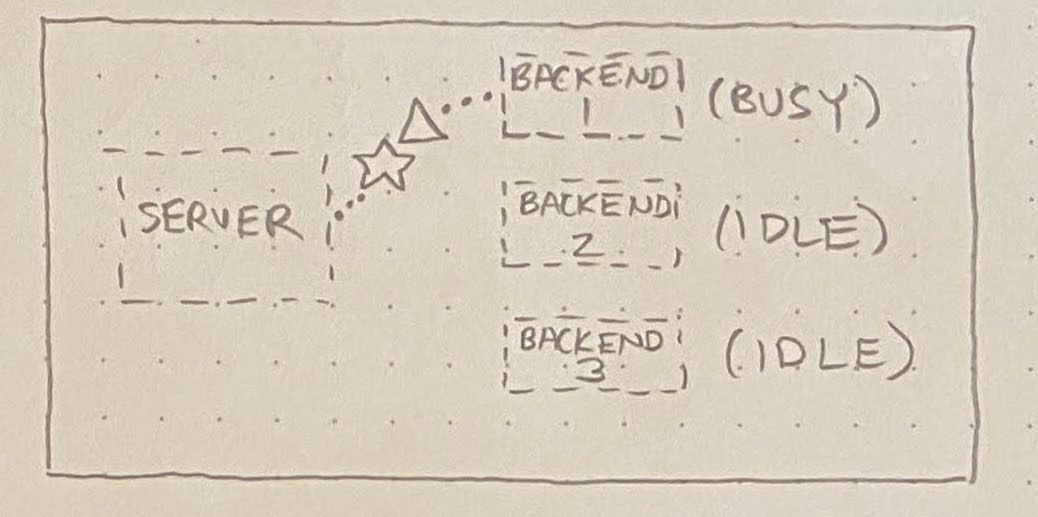
Anyway, the root cause (come at me) ended up being as follows. When requests arrive at the private registry, they’re served by one of N identical “backend” processes (in the diagrams below, N=3). A server distributes requests to these backends, always picking an idle backend if one exists:
If no backend is idle, then the server must queue up the incoming request behind an in-flight request:
What we found is that, occasionally, a particular script would execute an extremely long-running request against the registry API. This would normally be okay, but once in a blue moon, a few of these long-running requests would happen to hit the same server. This tied up multiple backends, resulting in one or more requests (☆) getting queued behind these pathologically long-running requests (△):
Altogether, this made for a very confusing set of observations:
Requests passing through the fronting API would occasionally take extra long, regardless of their content.
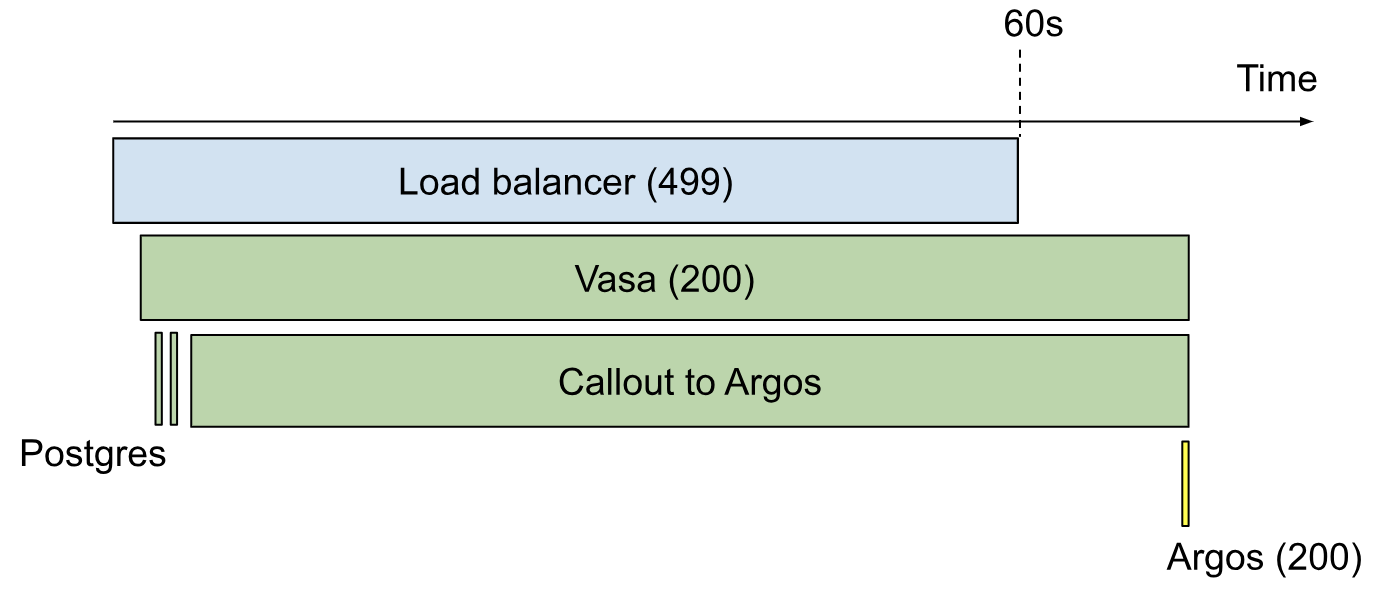
If one of these requests took longer than 10 seconds, a timeout would be reached in the CLI, resulting in a customer-facing error message. In this situation,
The request would continue running in the fronting API, and would be logged by that system as a high-latency 200.
This same request would be logged as a low-latency 200 at the registry level, since that subsystem would not start its stopwatch until the backend started processing the request.
At the load balancer, this request would be logged as a 499, which means “the client closed its connection before we could send a response.”
If one of these requests took longer than 60 seconds, though, a load balancer timeout would be reached.
The fronting API would log a 499
The load balancer would log a 502 Bad Gateway
The registry would never log this request at all.
The confusing nature of these symptoms is what made this issue such a perfect model for our troubleshooting interview.
How I turned this into an interview question
A while after this confusing incident was resolved, I was faced with the prospect of hiring SREs for my team. Since I’m very much a “squeeze the problems out of the system you have” person, rather than a “build new stuff with less problems” person, I wanted to make sure our interview process screened for good diagnostic skills.
So I reviewed the registry timeouts incident. How could I turn that messy, roundabout, real-world investigation into an approachable interview question that would help me gauge a candidate’s troubleshooting skills?
I changed some names, removed a couple complicating factors that would just muddy the waters, and wrote up a training document for interviewers. The training document included:
A description of the hypothetical architecture in which the exercise would take place;
A detailed explanation of the issue to be investigated, including discussion of the implications this issue would carry for observable artifacts (e.g. metrics, logs, traces, error messages);
A guide to conducting the interview (what to say, what not to say, how to evaluate responses).
The document’s description of our hypothetical architecture included a bird’s-eye-view diagram of our made-up architecture:
A service called “Vasa” took the place of the fronting API described earlier. Postgres was included in the diagram despite its irrelevance, introducing a bit of misdirection.
To stand in for the private registry where all the queueing nonsense happened, I made up a microservice called “Argos.” It’s not shown in the bird’s-eye-view diagram. Instead, once the candidate localized the problem to the Argos service, I’d show them another, more zoomed-in diagram that included details of the Argos architecture.
One key modification was that I made Argos (the private registry stand-in) into a generic “workspace metadata storage service.” I didn’t want candidates to fixate on the software-registry aspect of the problem, since that wasn’t especially relevant. People understand metadata storage and retrieval, and it’s boring, so they don’t ask many questions about it.
Conducting the interview
The actual interview takes the form of a role-playing game, almost D&D-esque. I start with a brief spiel:
This is going to be a sort of troubleshooting roleplay adventure, in which you play as an SRE investigating a system problem. I'll lay out the system and the problem under investigation, and you'll get to ask questions and take actions as you see fit. As you learn new things, we can take notes in the Google Doc which I'm sharing now. Sound good? Shall we get started?
After a bit of experience, I added another section to the intro:
The exercise we're going to do is based on a real-world bug that took a team of 4 people several weeks to figure out. I mention this because I don't want you to get to the end of the interview and think, "Oh no! I didn't solve the problem! I must have failed the interview." It's very common for candidates to run out of time without finding the answer but still do very well. I'm much more interested in how you go about investigating the problem than in how far you get.
With that, I show them the architecture diagram (above) and give a bird’s-eye-view description of the system they now “own.” Then we get into the problem:
One day, you get assigned a ticket. According to the ticket, the support team has been getting an increasing number of reports of an issue in which a customer runs a "Get Workspace" command in the CLI, and the CLI hangs for 10 seconds before printing this message and crashing:
ERROR: timeout waiting for response from server
Several users have additionally reported that, if they immediately re-run their "Get Workspace" command, it succeeds as normal in under 200 milliseconds.
“Alright,” I say to the candidate, “so you’re assigned this ticket. What do you do first?”
From here, different candidates go in all sorts of different directions. Some want to ask more questions of the support team. Some want further clarity on the architecture. Some immediately dive into logs and metrics. I don’t try to guide them. I just make up plausible answers to their questions, given my knowledge of the underlying problem. For example:
CANDIDATE: Can I ask the support team if there was anything else in common between the customer reports that they received?
ME: Sure. Support doesn't understand quite what you're asking, but they give you links to all the relevant tickets. What do you look for?
CANDIDATE: Are all the tickets from the same part of the world, or all from the same time of day or something?
ME: You don't see any common geographic characteristics. Some of the customers are from North America, some are from Asia, some are from Australia. It does seem, from your limited sample, that most of the reports are from North American business hours, roughly mid-day, on weekdays.
Even this early in the interview, I can sometimes detect warning signs. If a candidate immediately jumps to a specific hypothesis and gets stuck on it, I’m pretty sure this interview isn’t going to go well. But I’ll let them keep going:
CANDIDATE: This sounds like a caching issue, because the requests are failing once and then succeeding on the second try. Are there any caches in the system that might be timing out?
ME: There are many caching layers. There are filesystem caches, of course, and there's the buffer cache in the database. Some data items are cached in Memcache, as you can see in the diagram, and then some of the microservices have caching layers of their own.
CANDIDATE: Okay, then I guess I'd look at the health of those caching layers.
ME: Alright. How would you look at their health? What kinds of things would you look for?
CANDIDATE: Like error messages, high CPU usage, that sort of thing.
This candidate is not likely to do well. Instead of asking targeted questions to hone in on the location of the problem, they’ve leapt to a specific kind of problem (probably one they’ve seen recently in their job) based on very little evidence. Moreover, they’re not looking for the right kind of evidence. They’re looking for evidence that would confirm their suspicion, but when they don’t find any, their suspicion still won’t be ruled out. They could spin their wheels like this for the whole hour. But if that’s what they want to do, I’ll let them.
Since the problem under investigation is sporadic (about 1 in every 10,000 requests), any approach that involves looking at aggregate system-health stats will reach a dead-end pretty quickly. Even good candidates may initially set out in the system-health direction, but they’ll quickly recognize the dead-end and incorporate this new information into their reasoning. They’ll adapt and find a new strategy.
One such strategy is to try to find evidence of the failed requests in the system logs. But I make them work for it:
CANDIDATE: I look in the logs to try to find the requests that are timing out.
ME: Okay. Which logs do you look in? We've got logs from the load balancer, logs from the Vasa service, logs from the DB…
CANDIDATE: The ones for the Vasa service.
ME: The Vasa service has both access logs and error logs. Which one do you want to search?
CANDIDATE: Let's look at the access logs for now.
ME: Cool. How do you find the entries you're interested in?
CANDIDATE: Oh. Hmm. Do we have the client IP addresses for any of the timeouts?
ME: You search through the support tickets, but you don't find any client IP addresses.
CANDIDATE: I guess then I would try to find requests for the Get Workspace endpoint that lasted longer than 9.99 seconds.
When a candidate gives me enough information for a log search, I’ll make up some results, being sure to also document the parameters that were included in the search. For example,
Searching in the Vasa access logs for Get Workspace requests that lasted longer than 9.99 seconds in the last 24 hours, you find:
– 1000 total
– 900: response code 200
– 100: response code 503
This is progress, but candidates often get stuck here for a couple reasons. Some get hung up on the request latencies. They’ll look for requests with latencies of exactly 10 seconds (of which there are none), or they’ll look for requests with latencies around 10 seconds (of which there are a few, most of which are unrelated to the problem at hand.) In the real-world investigation, we found that the borked requests as logged by Vasa had latencies ranging all the way up to 60 seconds, but because the request timeout built into the CLI was 10 seconds, the client would only hang for 10 seconds.
Other candidates would get hung up on the response codes. Since customers are experiencing errors, the investigator would assume that the 503 responses in the log search results above are the ones causing the problem. But in reality, it’s the 200s. Due to mismatched timeouts, the stuck requests can linger in Vasa and Argos until well after the client has gone away, ultimately succeeding but without any client to return their 200 result to.
Once a candidate finds a specific request that they suspect represents an instance of the problem, they usually want to look at a trace. In this situation, I simply draw one by hand using the Insert => Drawing command in the Google Doc. Here’s such a drawing:
And so the process goes back and forth like this until time runs out. In all the dozens of times I administered this interview, no one ever made it to the end. But, just like I told candidates at the beginning, that’s not what I cared about anyway.
At the end, I ask the candidate to do one last thing:
Alright, you've gotten pretty far, but now let's suppose it's time for you to go home. Maybe you're even going on vacation. How will you update the ticket?
With this prompt, I’m hoping the candidate will describe:
the relevant new facts they’ve observed,
the explanations they’ve ruled out, and
what they recommend doing next.
A candidate who simply lists all the actions they’ve taken and the results of those actions is missing the point. I want to see that they can synthesize their observations into a coherent and succinct form that a colleague with comparable skills will be able to easily pick up where they left off.
Evaluating results
The evaluation of candidates’ performance on this interview goes directly back to the troubleshooting skills that I enumerated at the beginning:
Can they distinguish relevant from irrelevant facts?
If they spent long periods going down rabbit holes that had nothing to do with the timeouts under investigation, then the answer is “no.”
Do they seek to answer specific questions?
When candidates are strong in this area, they’ll reason out loud about their hypotheses. I’ll know why they’re asking for a specific piece of information because they’ll tell me why.
It’s also pretty easy to tell when a candidate is just throwing stuff at the wall to see if anything sticks, and that’s big points off. This is not how you troubleshoot effectively.
Will they keep an open mind about the cause of a problem, rather than jumping to a conclusion?
Often, candidates will fixate on a particular area of the stack. “This really feels like a database problem…” or the like is a common thing to hear. Of course it’s okay – and often good – to have a hunch. But the difference between ineffective and effective troubleshooters is that the ineffective ones will keep trying to prove their hunch right, whereas the effective ones will try to prove it wrong.
Are they able to express their thought process to a colleague?
The “update the ticket” question at the end is very helpful here, but I can usually get solid evidence on this well before then. Throughout the exercise, a good troubleshooter will recognize shifts in their thinking and note them aloud. A not-so-good troubleshooter will leave me in the dark.
When they hit a dead end, will they get discouraged? Or will they calmly seek out a different approach?
On many occasions, I’ve seen candidates get discouraged at a perceived lack of progress. Usually I try to help them find a different direction to go in, and then they’re able to pick their momentum back up. But some people just shut down and stop playing the game. Others go all the way back to the beginning and start casting about for hints in seemingly random parts of the stack. These are signs that the candidate lacks the doggedness required to consistently troubleshoot difficult problems.
Do they have a strategy?
This is what it’s all about. I’m looking to hire someone who makes efficient use of all the resources and information available. Someone who doesn’t just seek out information, but seeks out the particular information that will narrow the search space. It’s only these strategic thinkers who pass this interview, and having subsequently worked with several of them, I can confidently say that this interview technique gets great results.
As a Postgres reliability consultant and SRE, I’ve spent many hours being a rubber duck. Now I outperform even the incisive bath toy.
“Rubber duck debugging” is a widespread, tongue-in-cheek term for the practice of explaining, out-loud, a difficult problem that you’re stumped on. Often, just by putting our troubles into words, we suddenly discover insights that unlock progress. The person we’re speaking to could just as well be an inanimate object, like a rubber duck. Hence the term.
Rubber ducks are great, but a human can add even more value. In this article, I’ll share my 3 favorite questions to ask when someone comes to me feeling stumped in a troubleshooting endeavor. These questions work even when you have no particular expertise in the problem domain. Master them, and you’ll quickly start gaining a reputation as the person to talk to when you’re stuck. This is a great reputation to have!
Question 1: How did you first start investigating this?
As we investigate a problem, our focus shifts from one thing to another to another. We go down one path and forget about others. We zoom in on details and neglect to zoom back out. It’s easy to lose perspective.
“How did you first start investigating this?” works well because, through the act of recounting their journey from initial observation to where they are now, your colleague will often regain perspective they’ve lost along the way. And by asking this particular question, you avoid having to suggest that they may have lost perspective – which could make them defensive.
Even if your colleague hasn’t lost perspective, hearing the story of the investigation so far will help you ask better questions and help them organize their thoughts.
Question 2: What observations have you made?
In troubleshooting a complex problem, it’s easy to forget what you already know. As you go along, you make lots of observations, small and large, interesting and boring, relevant and irrelevant. You can’t hold them all in your head.
When someone’s stuck, it often helps to review their observations. Not theories, not difficulties, not actions: directly observed facts.
Reviewing observations can help in a few different ways:
They may be entertaining a hypothesis that clashes with some previously learned (but since forgotten) fact. If so, they can now go ahead and discard that hypothesis.
Juxtaposing two observations may suggest a hypothesis that never occurred to them before, because they never held those two observations in their head simultaneously.
Listing out their observations may bring to mind something they haven’t looked at yet.
As your colleague recounts their observations, write them down in a numbered list. And, if you can, ask clarifying questions. Questions like “Does X always happen concurrently with Y, or only sometimes?” and “How does this differ from the normal behavior?”
Never underestimate the power of precisely stating the facts.
Question 3: If your hypothesis were wrong, how could we disprove it?
This question is my favorite.
One of the most common ways people get stuck in troubleshooting is tunnel vision. They get a single idea in their head about the cause of the problem, and that becomes all they can think about.
This question, “If your hypothesis were wrong, how could we disprove it?” flips the script. Instead of racking their brain trying to prove their theory, it gets them thinking about other possibilities. Asking this question can lead to lots of different outcomes, all of which represent progress:
You come up with a way to disprove the hypothesis, and successfully disprove it. This may make your colleague sad for a few hours, but when they come back to the problem, they’ll make huge strides.
You come up with a way to disprove the hypothesis, but fail to disprove it. The hypothesis is thus bolstered, and the next step becomes clear: elaborate a few different versions of it and try to disprove those.
You can’t think of any way to disprove it. This means it’s probably not a hypothesis at all, since it’s not falsifiable. Therefore you must replace it with a new hypothesis. This may feel like a setback, but it’s really the only way forward.
As an SRE, I’m a vocal believer in following one’s nose: seeking out surprising phenomena and getting to the bottom of them. By adopting this habit, we can find and fix many classes of problems before they turn into incidents. Over time, this makes things run much smoother.
But what is surprising? How do we decide what to ignore and what to chase down?
Here are 5 kinds of surprise that are worth digging into in production data.
Keep in mind that this list is based on one SRE’s experience. Someone else, with different intuitions about system behavior, would make a different list. And that list would be more valuable to them than this list.
The most important thing is not that we always pick the right surprises to investigate. It’s that we make time, consistently, to seek out and explain surprises.
Anyway. Here’s my list.
1. Long running requests
Pick a time window. Sort all the requests during that window descending by duration. At the top of this list, you’ll find classes of requests that spent extraordinarily long in your system.
Were you expecting to see these specific kinds of requests? If not, then congratulations: you’re surprised. And this is quite likely a surprise worth investigating, because
while these slow requests are running, they’re eating up resources (CPU, memory, sockets, and so on), which gives them an outsized potential to degrade the performance of other, unrelated requests.
without intervention, the underlying problem will probably get worse over time. Why wouldn’t it? It has already gotten this bad. And if it gets bad enough, it will eventually cause customer pain.
many of the phenomena contributing to this slowness probably affect a variety of requests. So, if you can make these requests perform better, you may be able to make other requests perform better too.
We don’t have to rigorously analyze and optimize every slow request that goes through the system. Just by coming to understand the issues that cause our slowest requests to be slow, we often find opportunities to make high-impact improvements and mitigate the risk of ending up on an incident call later.
2. Saturation
Saturation is when units of work are waiting in a queue to be processed – be they web requests, or IP packets, or threads, or what have you.
To the extent we’re trying to serve each request as quickly as possible, saturation anywhere is waste. We shouldn’t expect any saturation. Or, at least, we should strive to thoroughly understand every source of it. If we don’t understand it, it will probably get worse over time.
Find every metric that represents a saturation. Put them all on one dashboard. Look at that dashboard every day.
3. Crashes
Every time an exception bubbles up to the top of the stack, that’s unexpected. If it were expected, then the code would have caught and handled the exception.
A tool like Sentry or Datadog Error Tracking (I mention these specific products only because I know them, not because they’re necessarily the best) lets you classify crashes, and see which ones are new or getting more frequent. Granted: it’s often the case that there are far too many classes of crash to investigate all or even most of them. But this shouldn’t stop us from chasing down some of them, according to our intuition about their relative importance.
We have imperfect information until we get our hands dirty, so we won’t always end up picking the highest-impact investigations to undertake. But fixing crashes is always better than ignoring them, and by dividing up the extant crashes into groups and prioritizing one group at a time, we can create some very useful guarantees.
For example, if we find all the crashes that correspond to deadlocks, and fix those, then we guarantee that our system has no deadlocks. Thereafter, problems caused by deadlocks – which tend to be subtle, elusive, and therefore time-consuming to solve – can no longer quietly sow chaos.
4. Utilization spikes
It’s expected for a utilization metric (for example, network bandwidth or memory utilization) to move around a lot. But it’s not expected for utilization to exhibit large spikes. When this happens, it means some recurring event is using more than its fair share of some resource.
When utilization hits 100%, things will degrade catastrophically and immediately. So if you have utilization spikes representing 20% of capacity, then steady-state utilization only has to be 80% before catastrophic degradations start occurring. Or, if the spikes gets worse, and now they’re 30% of capacity, then 70% capacity becomes the new safe limit. We’ll have to waste at least 30% of our capacity by leaving it idle in order to prevent outages.
So why not understand the spikes now, before they get worse?
5. Correlation between latency and throughput
When we see recurring swings in latency metrics, it’s easy to say to ourselves, “Yeah, well, when we’re under more load, things slow down.” But… why? Systems don’t always behave like that! They do it when there’s a bottleneck. If the system were behaving as expected and no resources were exhausted, then the latency graph would be more or less flat.
In other words, if traffic tends to be higher mid-day on weekdays, and latency also tends to rise mid-day on weekdays, then you’re likely saturating at least one resource. Would you rather find that bottleneck now, or during an incident?
I hope this list is a good place to start if you’re looking to dig up problems. But, ultimately, you must be the judge of what’s surprising to you. Find something you can’t explain. Explain it. Repeat.
A bug in our deployment system causes O(N²) latency with respect to the number of deploys that have been performed. At first, it’s too minuscule to notice. But the average deploy latency grows over time. Eventually, deploys start randomly timing out. The deploy pipeline grinds to a halt, and it becomes an emergency.
Or maybe, if we think critically about the deploy latency time series soon enough, it might be obvious well in advance that something’s getting worse. We can fix this problem before it becomes a crisis. But in order to see it, we have to look. And we have to give ourselves time to go down the rabbit hole.
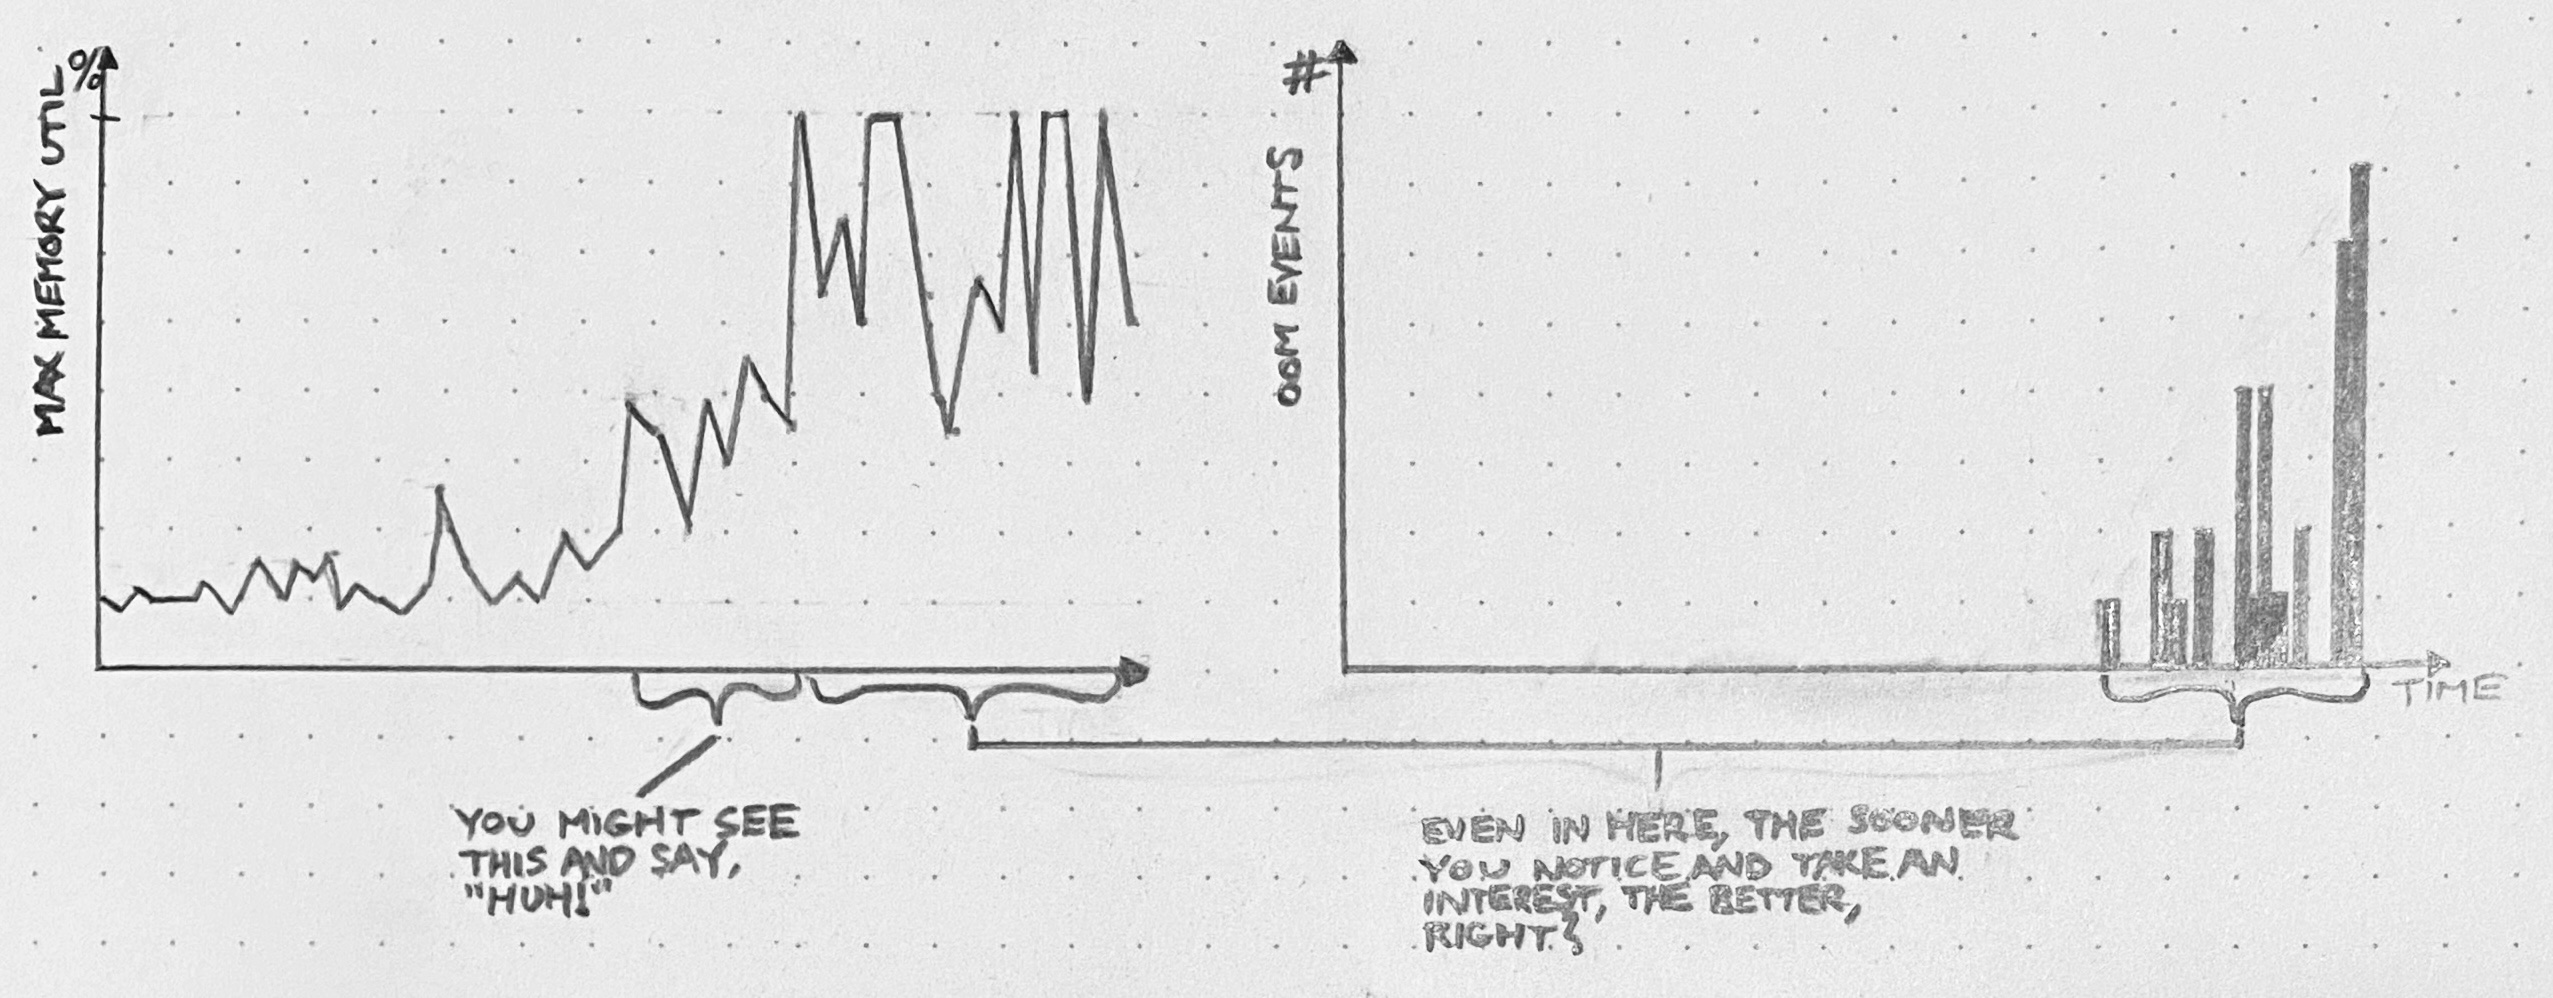
An API server has an edge case that leads to unconstrained memory usage. At first, this edge case only gets hit occasionally, and the API server’s memory usage stays well below capacity. But, as usage patterns evolve, we start to hit this bug more frequently, with larger and larger allocations of memory. For a while, we’re still below the OOMkill threshold. Once we start hitting that threshold, things get ugly. If we still continue to ignore it, then eventually, things will get so ugly that we’ll have to drop what we’re doing and fix this bug.
We had opportunities to see this coming. Depending on our willingness to dig in and investigate surprising phenomena, we could have discovered this problem when the OOMkills started, or even before they started – when these blips were just spikes on a memory graph.
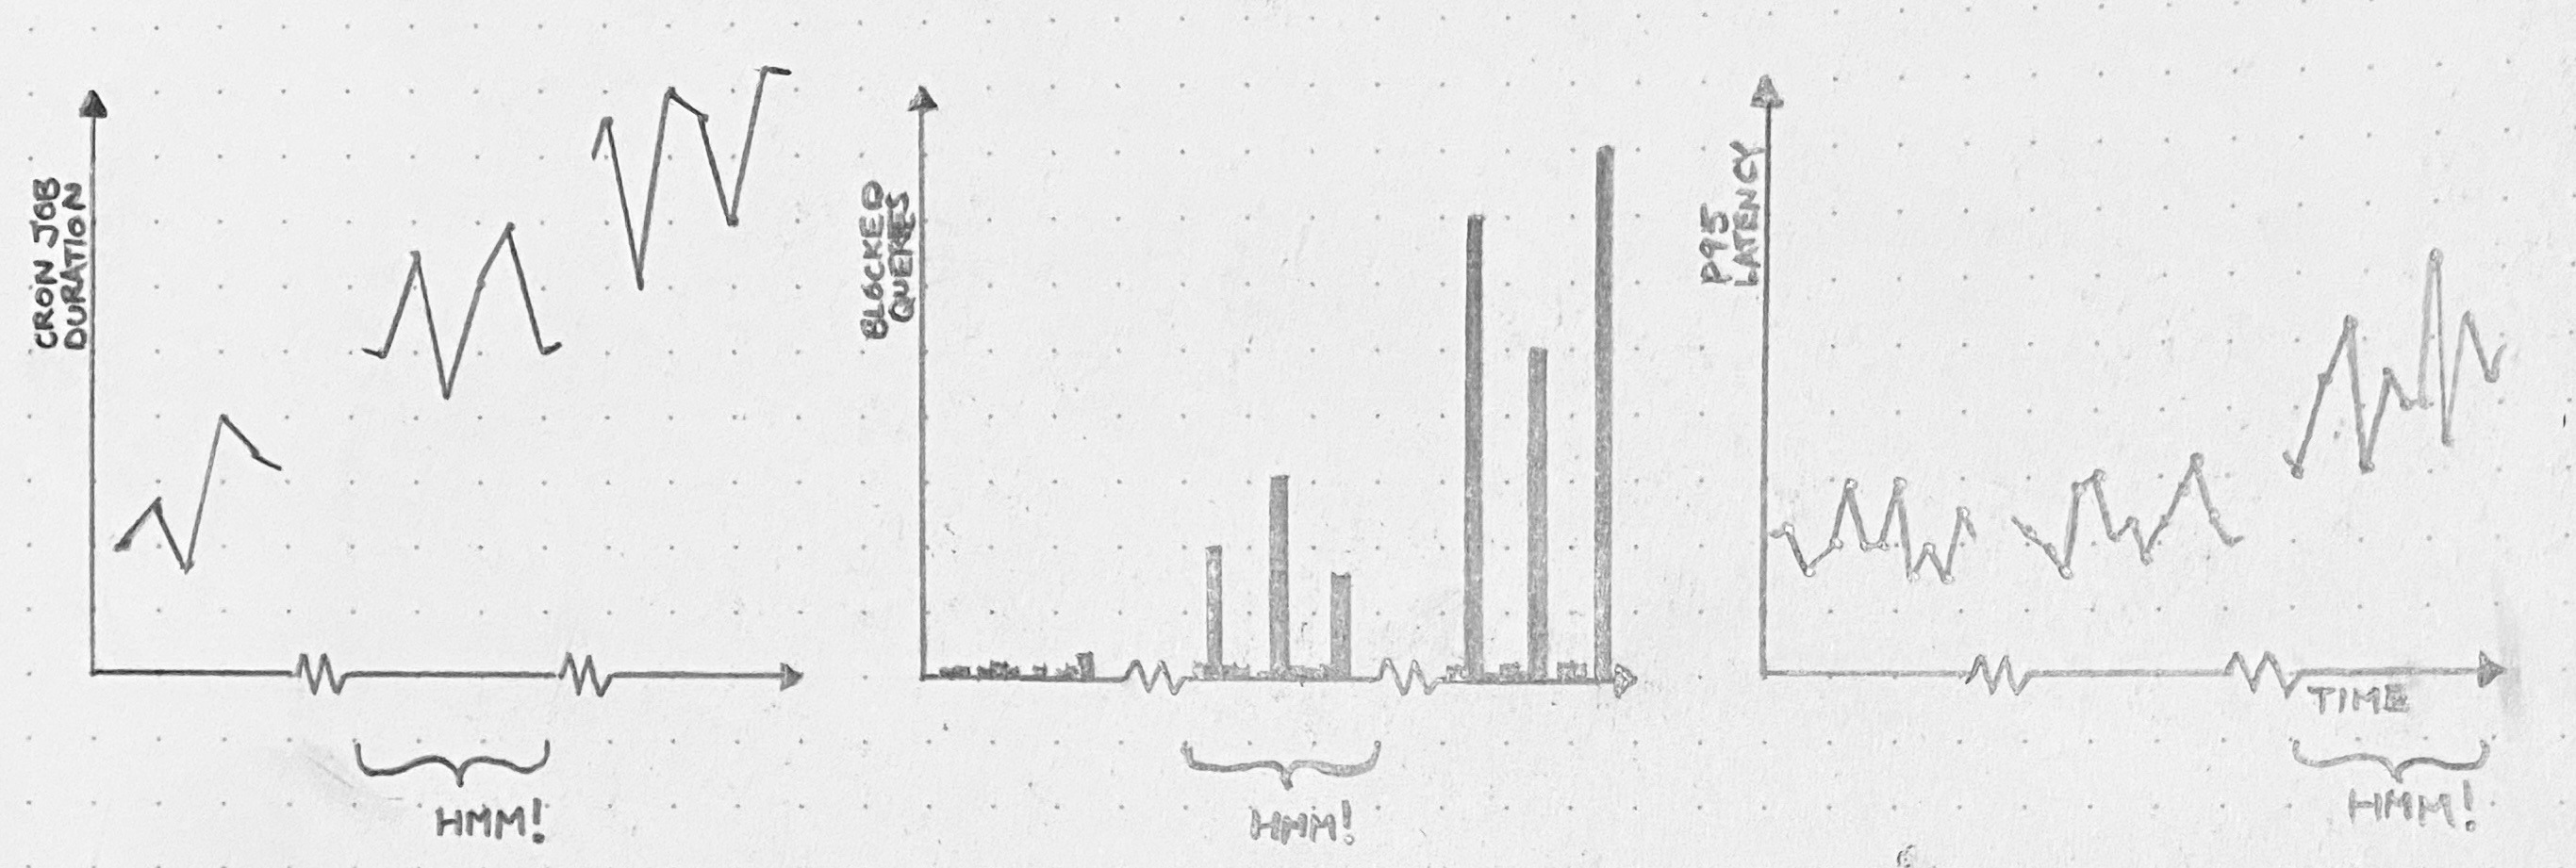
A cron job runs every 30 minutes, and while it runs, it holds a database lock. When it’s first deployed, the cron job doesn’t have much to do, so it runs fast, and no one suffers. Over months, though, the cron job grows sluggish. It just has more work to do. Query pileups start to occur every 30 minutes. We start seeing significant impact on the latency of our application. And, one day, there’s an outage.
We’ll wish we’d dug in back when it was just a slow cron job. Or even when it was just query spikes.
You can prevent many things from turning into fires, but you need space. Space to be curious, to investigate, to explain your findings to yourself and others.
Suppose you spent a week looking for trouble like this, and you only happened to find 1 issue out of these 3. That’s still great, right? Compared to the cost of letting it become a disruption later?
When a system fails, it’s silly to blame practitioners for not seeing the signs. But that doesn’t mean we shouldn’t put in a serious effort to see the signs. If you give yourself space to follow the Huh!, you get opportunities to fix problems before they get worse.
Every time our system fails, and we go to analyze the failure, we find ourselves saying things like “We didn’t know X was happening,” “we didn’t know Y could happen,” and so on. And it’s true: we didn’t know those things.
We can never predict with certainty what the next system failure will be. But we can predict, because painful experience has taught us, that some or all of the causes of that failure will be surprising.
We can use that!
When we go looking at data (and by “data” I mostly mean logs, traces, metrics, and so on, but data can be many things), sometimes we see something weird, and we go like, Huh!. That Huh! is a signal. If we follow that Huh! – get to the bottom of it, figure it out, make it not surprising anymore – two things happen. First, we get a chance to correct a latent problem which might some day contribute to a failure. And second, we make our mental model that much better.
Of course, any individual Huh! could turn out to be nothing. Perhaps there’s a bug. Perhaps circumstances have shifted, and our expectations no longer line up with reality. Or perhaps it’s just a monitoring blip. We won’t know until we run it down.
But, whatever the shortcomings of any particular investigation, a habit of investigating surprises has many attractive qualities. The main one is that we get to fix problems before those problems get worse, start bouncing off other problems, and cause fires. In other words: our system runs smoother. Consider what that’s worth.
In an organization that delivers a software service, almost all R&D time goes toward building stuff. We figure out what the customer needs, we decide how to represent their need as software, and we proceed to build that software. After we repeat this cycle enough times, we find that we’ve accidentally ended up with a complex system.
Inevitably, by virtue of its complexity, the system exhibits behaviors that we didn’t design. These behaviors are surprises, or – often – problems. Slowdowns, race conditions, crashes, and so on. Things that we, as the designers, didn’t anticipate, either because we failed to consider the full range of potential interactions between system components, or because the system was exposed to novel and unpredictable inputs (i.e. traffic patterns). Surprises emerge continuously, and most couldn’t have been predicted a priori from knowledge of the system’s design.
R&D teams, therefore, must practice 2 distinct flavors of engineering. Prescriptive engineering is when you say, “What are we going to build, and how?”, and then you execute your plan. Teams with strong prescriptive engineering capabilities can deliver high-quality features fast. And that is, of course, indispensable.
But prescriptive engineering is not enough. As surprises emerge, we need to spot them, understand them, and explain them. We need to practice descriptive engineering.
Descriptive engineering is usually an afterthought
Most engineers rarely engage with production surprises.
We’re called upon to exercise descriptive engineering only in the wake of a catastrophe or a near-catastrophe. Catastrophic events bring attention to the ways in which our expectations about the system’s behavior have fallen short. We’re asked to figure out what went wrong and make sure it doesn’t happen again. And, when that’s done, to put the issue behind us so we can get back to the real work.
In fact, descriptive engineering outside the context of a catastrophe is unheard of most places. Management tends to see all descriptive engineering as rework: a waste of time that could have been avoided had we just designed our system with more forethought in the first place.
The complexity of these systems makes it impossible for them to run without multiple flaws being present. Because these [flaws] are individually insufficient to cause failure they are regarded as minor factors during operations. … The failures change constantly because of changing technology, work organization, and efforts to eradicate failures.
A complex system’s problems are constantly shifting, recombining, and popping into and out of existence. Therefore, descriptive engineering – far from rework – is a fundamental necessity. Over time, the behavior of the system diverges more and more from our expectations. Descriptive engineering is how we bring our expectations back in line with reality.
In other words: our understanding of a complex system is subject to constant entropic decay, and descriptive engineering closes an anti-entropy feedback loop.
Where descriptive engineering lives
Descriptive engineering is the anti-entropy that keeps our shared mental model of the system from diverging too far from reality. As such, no organization would get very far without exercising some form of it.
But, since descriptive engineering effort is so often perceived as waste, it rarely develops a nucleus. Instead, it arises in a panic, proceeds in a hurry, and gets abandoned half-done. It comes in many forms, including:
handling support tickets
incident response
debugging a broken deploy
performance analysis
In sum: the contexts in which we do descriptive engineering tend to be those in which something is broken and needs to be fixed. The understanding is subservient to the fix, and once the fix is deployed, there’s no longer a need for descriptive engineering.
Moreover, since descriptive engineering usually calls for knowledge of the moment-to-moment interactions between subsystems in production, and between the overall system and the outside world, this work has a habit of being siphoned away from developers toward operators. This siphoning effect is self-reinforcing: the team that most often practices descriptive engineering will become the team with the most skill at it, so they’ll get assigned more of it.
This is a shame. By adopting the attitude that descriptive engineering need only occur in response to catastrophe, we deny ourselves opportunities to address surprises before they blow up. We’re stuck waiting for random, high-profile failures to shock us into action.
What else can we do?
Instead of doing descriptive engineering only in response to failures, we must make it an everyday practice. To quote Dr. Cook again,
Overt catastrophic failure occurs when small, apparently innocuous failures join to create opportunity for a systemic accident. Each of these small failures is necessary to cause catastrophe but only the combination is sufficient to permit failure. Put another way, there are many more failure opportunities than overt system accidents.
We won’t ever know in advance which of the many small failures latent in the system will align to create an accident. But if we cultivate an active and constant descriptive engineering practice, we can try to make smart bets and fix small problems before they align to cause big problems.
What would a proactive descriptive engineering practice look like, concretely? One can imagine it in many forms:
A dedicated team of SREs.
A permanent cross-functional team composed of engineers familiar with many different parts of the stack.
A cultural expectation that all engineers spend some amount of their time on descriptive engineering and share their results.
A permanent core team of SREs, joined by a rotating crew of other engineers. Incidentally, this describes the experimental team I’m currently leading IRL, which is called Production Engineering.
I have a strong preference for models that distribute descriptive engineering responsibility across many teams. If the raison d’être of descriptive engineering is to maintain parity between our expectations of system behavior and reality, then it makes sense to spread that activity as broadly as possible among the people whose expectations get encoded into the product.
In any case, however we organize the effort, the main activities of descriptive engineering will look much the same. We delve into the data to find surprises. We pick some of these surprises to investigate. We feed the result of our investigations back into development pipeline. And we do this over and over.
It may not always be glamorous, but it sure beats the never-ending breakdown.
Take a nontrivial software system and put it on the internet. Problems will emerge. Some problems will be serious; others less so. We won’t notice most of them.
A software system in production is a bucket filled with fluid. Each particle of the fluid is a discrete problem. The problems bounce around and collide with each other and do all kinds of stochastic stuff from moment to moment.
At the very bottom of the bucket are problems so minute that they can hardly be called problems at all. They have low energy. They don’t interact much with each other or with anything else.
Higher up, you find higher-and-higher-energy particles. Problems that cause small hiccups, or sporadic bouts of sluggishness.
Somewhere near the top, there’s a threshold. When a problem gets enough energy to cross this threshold, we passively notice it. Maybe it causes an outage, or maybe it just causes a false positive alert. Maybe a support ticket gets filed. Maybe it’s just a weird spike in a graph. However we perceive it, we’re forced to take it seriously.
Once problems get enough energy, we can’t help but notice them. But before that, they already exist.
What happens before a particle jumps this energy threshold?
Perhaps the problem is entirely novel – no part of it existed before now. A code deploy with a totally self-contained bug. A DOS attack. If it’s something like that: oh well.
But more often, a problem we just perceived has been acted upon by a more gradual process. Problems bounce around in the bucket, and occasionally they bounce into each other and you get a problem with higher energy than before. Or circumstances shift, and a problem that was once no big deal becomes a big deal. Over time, particles that started in the middle – or even at the bottom – can work their way up to the passive perception line.
If problems usually hang out below the perception threshold for a while before they cross it, then we can take advantage of that in two ways. One way is to lower the threshold for passive perception. Raise the sensitivity of our monitors without sacrificing specificity. This is hard, but worthwhile.
The other way to take advantage of the fluid-like behavior of problems is to spend energy finding and fixing problems before they boil. I call this the Maxwell’s demon approach. You go looking for trouble. You poke around in dashboards and traces and logs, find things that look weird, turn them around in your hands until you understand them, and ultimately fix them. Maybe you have a ticket backlog of possible problems you’ve found, and it’s somebody’s job to burn down that backlog. Ideally it’s the job of a team using a shared-context system like differential diagnosis.
If you make it somebody’s job to be Maxwell’s demon, you can find and fix all sorts of problems before they become bigger problems. If you don’t make it someone’s job, then no problem will get taken seriously until it’s an outage.
I was pretty happy with my talk, especially the Star Trek: The Next Generation vignette in the middle. It was a lot of ideas to pack into a single talk, but I think a lot of people got the point. However, I did give a really unsatisfactory answer (30m46s) to the first question I received. The question was:
In the differential diagnosis steps, you listed performing tests to falsify assumptions. Are you borrowing that from medicine? In tech are we only trying to falsify assumptions, or are we sometimes trying to validate them?
I didn’t have a real answer at the time, so I spouted some bullshit and moved on. But it’s a good question, and I’ve thought more about it, and I’ve come up with two (related) answers: a common-sense answer and a pretentious philosophical answer.
The Common Sense Answer
My favorite thing about differential diagnosis is that it keeps the problem-solving effort moving. There’s always something to do. If you’re out of hypotheses, you come up with new ones. If you finish a test, you update the symptoms list. It may not always be easy to make progress, but you always have a direction to go, and everybody stays on the same page.
But when you seek to confirm your hypotheses, rather than to falsify others, it’s easy to fall victim to tunnel vision. That’s when you fixate on a single idea about what could be wrong with the system. That single idea is all you can see, as if you’re looking at it through a tunnel whose walls block everything else from view.
Tunnel vision takes that benefit of differential diagnosis – the constant presence of a path forward – and negates it. You keep running tests to try to confirm your hypothesis, but you may never prove it. You may just keep getting tests results that are consistent with what you believe, but that are also consistent with an infinite number of hypotheses you haven’t thought of.
A focus on falsification instead of verification can be seen as a guard against tunnel vision. You can’t get stuck on a single hypothesis if you’re constrained to falsify other ones. The more alternate hypotheses you manage to falsify, the more confident you get that you should be treating for the hypotheses that might still be right.
Now, of course, there are times when it’s possible to verify your hunch. If you have a highly specific test for a problem, then by all means try it. But in general it’s helpful to focus on knocking down hypotheses rather than propping them up.
Karl “Choke Right On It, Logical Positivism” Popper
Published in 1959 – but based on Popper’s earlier book Logik der Forschung from 1934 – The Logic Of Scientific Discovery makes a then-controversial [now widely accepted (but not universally accepted, because philosophers make cats look like sheep, herdability-wise)] claim. I’ll paraphrase the claim like so:
Science does not produce knowledge by generalizing from individual experiences to theories. Rather, science is founded on the establishment of theories that prohibit classes of events, such that the reproducible occurrence of such events may falsify the theory.
Popper was primarily arguing against a school of thought called logical positivism, whose subscribers assert that a statement is meaningful if and only if it is empirically testable. But what matters to our understanding of differential diagnosis isn’t so much Popper’s absolutely brutal takedown of logical positivism (and damn is it brutal), as it is his arguments in favor of falsifiability as the central criterion of science.
I find one particular argument enlightening on the topic of falsification in differential diagnosis. It hinges on the concept of self-contradictory statements.
There’s an important logical precept named – a little hyperbolically – the Principle of Explosion. It asserts that any statement that contradicts itself (for example, “my eyes are brown and my eyes are not brown”) implies all possible statements. In other words: if you assume that a statement and its negation are both true, then you can deduce any other statement you like. Here’s how:
Assume that the following two statements are true:
“All cats are assholes”
“There exists at least one cat that is not an asshole”
Therefore the statement “Either all cats are assholes, or 9/11 was an inside job” (we’ll call this Statement A) is true, since the part about the asshole cats is true.
However, if the statement “there exists at least one cat that is not an asshole” is true too (which we’ve assumed it is) and 9/11 were not an inside job, then Statement A would be false, since neither of its two parts would be true.
So the only way left for Statement A to be true is for “9/11 was an inside job” to be a true statement. Therefore, 9/11 was an inside job.
Wake up, sheeple.
The Principle of Explosion is the crux of one of Popper’s most convincing arguments against the Principle of Induction as the basis for scientific knowledge.
It was assumed by many philosophers of science before Popper that science relied on some undefined Principle of Induction which allowed one to generalize from a finite list of experiences to a general rule about the universe. For example, the Principle of Induction would allow one to deduce from enough statements like “I dropped a ball and it fell” and “My friend dropped a wrench and it fell” to “When things are dropped, they fall.” But Popper argued against the existence of the Principle of Induction. In particular, he pointed out that:
If there were some way to prove a general rule by demonstrating the truth of a finite number of examples of its consequences, then we would be able to deduce anything from such a set of true statements.
Right? By the Principle of Explosion, a self-contradictory statement implies the truth of all statements. If we accepted the Principle of Induction, then the same evidence that proves “When things are dropped, they fall” would also prove “All cats are assholes and there exists at least one cat that is not an asshole,” which would prove every statement we can imagine.
So what does this have to do with falsification in differential diagnosis? Well, imagine you’ve come up with these hypotheses to explain some API slowness you’re troubleshooting:
Hypothesis Alpha: contention on the table cache is too high, so extra latency is introduced for each new table opened
Hypothesis Bravo: we’re hitting our IOPS limit on the EBS volume attached to the database server
There are many test results that would be compatible with Hypothesis Alpha. But unless you craft your tests very carefully, those same results will also be compatible with Hypothesis Bravo. Without a highly specific test for table cache contention, you can’t prove Hypothesis Alpha through a series of observations that agree with it.
What you can do, however, is try to quickly falsify Hypothesis Bravo by checking some graphs against some AWS configuration data. And if you do that, then Hypothesis Alpha is the your best remaining guess. Now you can start treating for table cache contention on the one hand, and attempting the more time-consuming process (especially if it’s correct!) of falsifying Hypothesis Alpha.
Isn’t this kind of abstract?
Haha OMG yes. It’s the most abstract. But that doesn’t mean it’s not a useful idea.
If it’s your job to troubleshoot problems, you know that tunnel vision is very real. If you focus on generating alternate hypotheses and falsifying them, you can resist tunnel vision’s allure.