
One day not long ago, as I was looking for trouble in a production system’s telemetry, I came across a puzzling phenomenon. I was examining the load balancer access logs for a particular API endpoint – an endpoint that does essentially nothing and should always return a 200 response within a handful of milliseconds. I saw this:
| Metric | Value | My reaction |
| 10th percentile latency | 10ms | Okay, |
| Median latency | 11ms | sure, |
| 75th pecentile latency | 14ms | fair enough, |
| 90th percentile latency | 160ms | mm-h– wait, |
| 99th percentile latency | 700ms | What?? |
“What gives?” I wondered aloud, cocking my head. “What could this request possibly be doing for 700 milliseconds? It has nothing to do.” That’s how I learned about an issue I’m calling upstream-local queueing. It’s a mostly stack-agnostic performance problem, and boy am I glad I found it early, because it has some dire scaling implications.
The problem
I’ll spare you a recapitulation of the head-scratching and data fumbling that ensued. Upstream-local queueing is when an upstream – an individual server tasked with responding to requests – is asked to handle more requests than it can handle concurrently. For example, suppose you have a cluster of load balancers, all of which independently distribute requests to upstreams. Each upstream has a maximum concurrency of 3.

Upstream-local queueing happens when, due to random chance, a particular upstream has 3 requests in flight, and happens to receive a 4th. The upstream can’t immediately start processing that 4th request, so it waits in a queue until some capacity frees up. And in the meantime, maybe a 5th request arrives. And so on.

So, even though the rest of the upstream cluster might have plenty of idle capacity available, these requests end up sitting around twiddling their thumbs, accumulating latency.
You’ll notice that I haven’t mentioned any particular technologies or load balancing algorithms yet. That’s because upstream-local queueing is a remarkably general phenomenon. The following system characteristics are sufficient for this problem to emerge:
- The upstreams have finite capacity to handle concurrent requests.
- The load balancer’s decisions about where to send each request are independent from each other.
Many systems satisfy these criteria.
It’s hard to observe
Upstream-local queueing can be tricky to observe directly. A queue can appear and disappear on any given upstream within a matter of milliseconds: far shorter than the time scales on which metrics tend to be collected. ULQ’s contribution to request latency therefore appears to be randomly distributed, and mostly 0.
Furthermore, at least in my case, the stack is not instrumented well for this. Upstream-local queueing occurs in somewhat of a black box. It’s an open-source black box, but due to the design of the component that’s handling these requests within the upstream, it’s non-trivial to observe the impact of ULQ.
Further furthermore, the severity of ULQ-caused latency is coupled to utilization, which in most real-world systems is constantly changing. And, furthestmore, unless you’re already in deep trouble, ULQ’s impact tends to be below the noise floor for all but the most painstaking measurement techniques.
The most painstaking measurement techniques
When I first set out to examine the upstream-local queueing phenomenon, I took a highly manual approach:
- Pick an upstream
- Search for load balancer access logs corresponding to requests that were sent to that upstream
- Dump a CSV of those log entries
- Run a script against the CSV that uses the timestamps and durations to reconstruct the number of requests in-flight to that upstream from instant to instant.
This was a pain in the ass. But I only had to do it 2 or 3 times before I determined that, yes: this was indeed happening, and it was causing nontrivial latency.
At this point, I was sure that I had found a big problem. But I couldn’t just go fix it. I needed to convince my colleagues. In spite of this problem’s recalcitrance to direct observation, I needed a clear and compelling demonstration.
A computational model
Lucky for me, queueing systems are easy to model!
I spent a day or two building a computational model of the behavior of an upstream under load. The model is on my GitHub. I won’t bore you with the details, but essentially, requests arrive at the upstream at a set interval, and each request takes a random amount of time to execute. If there are more than 12 requests in flight, further requests are queued until slots free up. We add up the number of microseconds spent queued versus in flight, and voilà: a working model that largely agrees with our real-world observations.
Here’s what the model told me:
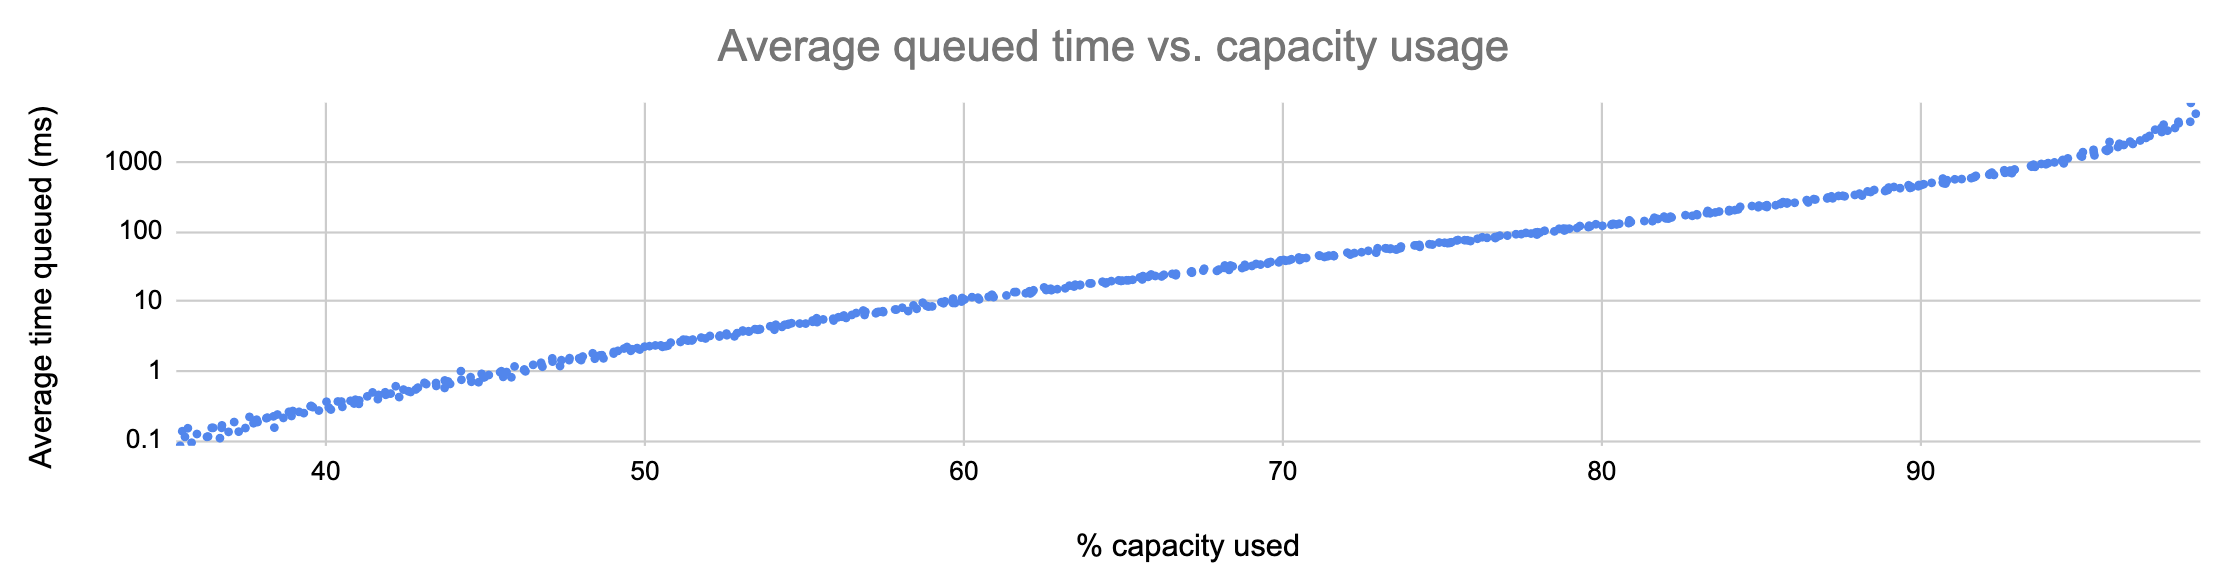
In the graph above, each point represents a run of the simulation with a different average request rate. As you can see, the average number of milliseconds spent by requests in the upstream-local queue is tightly correlated to utilization, and it grows more or less exponentially.
This is a huge problem! As more capacity is used, requests experience, on average, exponentially more latency:
| % capacity used | Average latency due to ULQ |
| 40% | 0.29ms |
| 50% | 2.22ms |
| 60% | 11.4ms |
| 70% | 38.4ms |
| 80% | 127ms |
| 90% | 461ms |
| 95% | 1372ms |
And remember: this is just on average. 90th- and 99th-percentile latencies can climb to unacceptable levels far sooner.
What’s worse, ULQ affects all requests equally. If the average added latency is, say, 10ms, then a request that would normally take 1000ms will instead take 1010ms, for a slowdown of 1%. But a request that would normally take 5ms will take on average 15ms: a 300% performance hit. This means more requests sitting around in your stack eating up resources for no good reason. It also means, if clients of your service tend to do many individual requests in sequence (like a web browser, for example), that overall user experience can suffer drastically before this problem even appears that bad.
What to do about it
As I said before, this is a quite general problem. Switching web servers won’t fix it, nor will scaling up. Switching from random-number to round-robin load balancing, or vice versa, will not fix it. There are 3 classes of solution.
The first class of solution is the dumbest. But hey, maybe you need your upstream-local queueing problem fixed now and you don’t have time to be smart. In this case, here’s what you do: set a threshold, and meet it by keeping enough of your capacity idle. Referring to the table above, if we decided on a threshold of 11ms average ULQ latency, then we’d need to keep at least 40% of our capacity idle at all times.
I told you it was dumb. But it is easy. The other two solutions are less easy.
The second solution is to reduce your application’s latency variance. If some requests take 10 milliseconds and others take 30000, then upstream-local queueing rears its ugly head. If, instead, all your requests take between 30 and 35 milliseconds (or between 3 and 3.5 seconds, for that matter), its effect is much less pronounced. By hacking away at the long tail of your latency distribution, you may be able to push the worst effects of ULQ further to the right-hand-side of the graph. But, at the end of the day, exponential growth is exponential growth. It’s not really a fix.
The best thing you can do, of course, is use a more sophisticated load balancing algorithm. This necessitates that your load balancing software supports one. If, for example, you use a least outstanding requests algorithm, then upstream-local queueing simply won’t occur until you’ve exhausted all of your upstream capacity. It ceases to be a scaling problem.
How to tell how bad ULQ is in your stack
For a quick and dirty answer to the question “How much latency is ULQ contributing in my system?” you can make a simple graph dashboard. Take the 90th percentile latency as measured by the load balancer, and subtract the 90th percentile latency as measured by the upstream.

If these curves grow and shrink along with your throughput, you probably have an upstream-local queueing problem. And if the peaks are getting higher, that problem is getting worse.
The numbers resulting from this calculation are not a rigorous measurement of anything in particular. You can’t really add or subtract percentiles. But it’s often a very easy calculation to do, and as long as you don’t make inferences based on the values of the numbers – just the shapes of the curves – you can get some quick confidence this way before you proceed with a deeper investigation. And then you can fix it.
