“Let’s track our production errors,” they said. “We’ll harvest insights,” they said. And 3 years later, all we have to show for it is an error tracking dashboard so bloated with junk that it makes us sick to look at.
When error tracking is working, engineers engage with it regularly, scrutinizing every new error thrown. This regular engagement is what transmutes raw error data into meaning. If engagement ceases (or never gets started) then, like bull thistle in a sad old garden, noise dominates.
Of course we often don’t realize how noisy the errors have gotten until things are already well out of hand. After all, we’ve got shit to do. Deadlines to hit. By the time we decide to get serious about error management, a huge, impenetrable, meaningless backlog of errors has already accumulated. I call this stuff slag.
Slag is viscous. Try to dig yourself out of the heap by brute force, one error at a time, starting with the most common, and you won’t get very far. After you investigate the top 10 errors and find out that 9 of them are complete non-issues that aren’t worth fixing, the wind will drain from your sails. Investigating errors takes a lot of time, and there are still 340 to go! Wait, I just refreshed the page and there’s 348 now.
Slag engenders hopelessness, and hopelessness drives teams to declare bankruptcy on error tracking.
The reason slag engenders hopelessness is because you’d have to dig through essentially all the slag in order to get any value. But by excluding behaviors, you can create incremental value as you burn down the error list. This changes the tradeoff, making error remediation work into something that’s immediately and obviously worth doing.
The magic of excluded behaviors
Suppose you have a list of errors that your system throws in production. Sorting this list by frequency-of-error and eyeballing it, you see that it contains about:
- 40 kinds of network timeouts
- 30 different JSON parse errors
- 20 Nil pointer exceptions, spread across the codebase
- 12 Postgres deadlocks
- … many more errors that are harder to lump into categories.
I would look at this list and say, “Well, deadlocks are never expected or desired, and they’re often contributing factors in larger problems… so let’s exclude deadlocks.” (Someone else, with different constraints and knowledge, might justifiably pick a different behavior to exclude.) Anyway, we pick a behavior, then we exclude it.
Here’s how you exclude a behavior:
- List all the individual errors in the class to be excluded.
- Burn down that list by fixing each underlying bug.
- Create a (non-paging) monitor to catch regressions.
When you exclude a behavior, you get immediate incremental value. Where before there was a system that would sometimes deadlock in production, now there’s a system that is known never to deadlock in production.
This guarantee is immensely valuable. By eliminating deadlocks from the system, you block off a whole range of ways that surprising failure modes could creep into your system. This yields a direct increase in reliability.
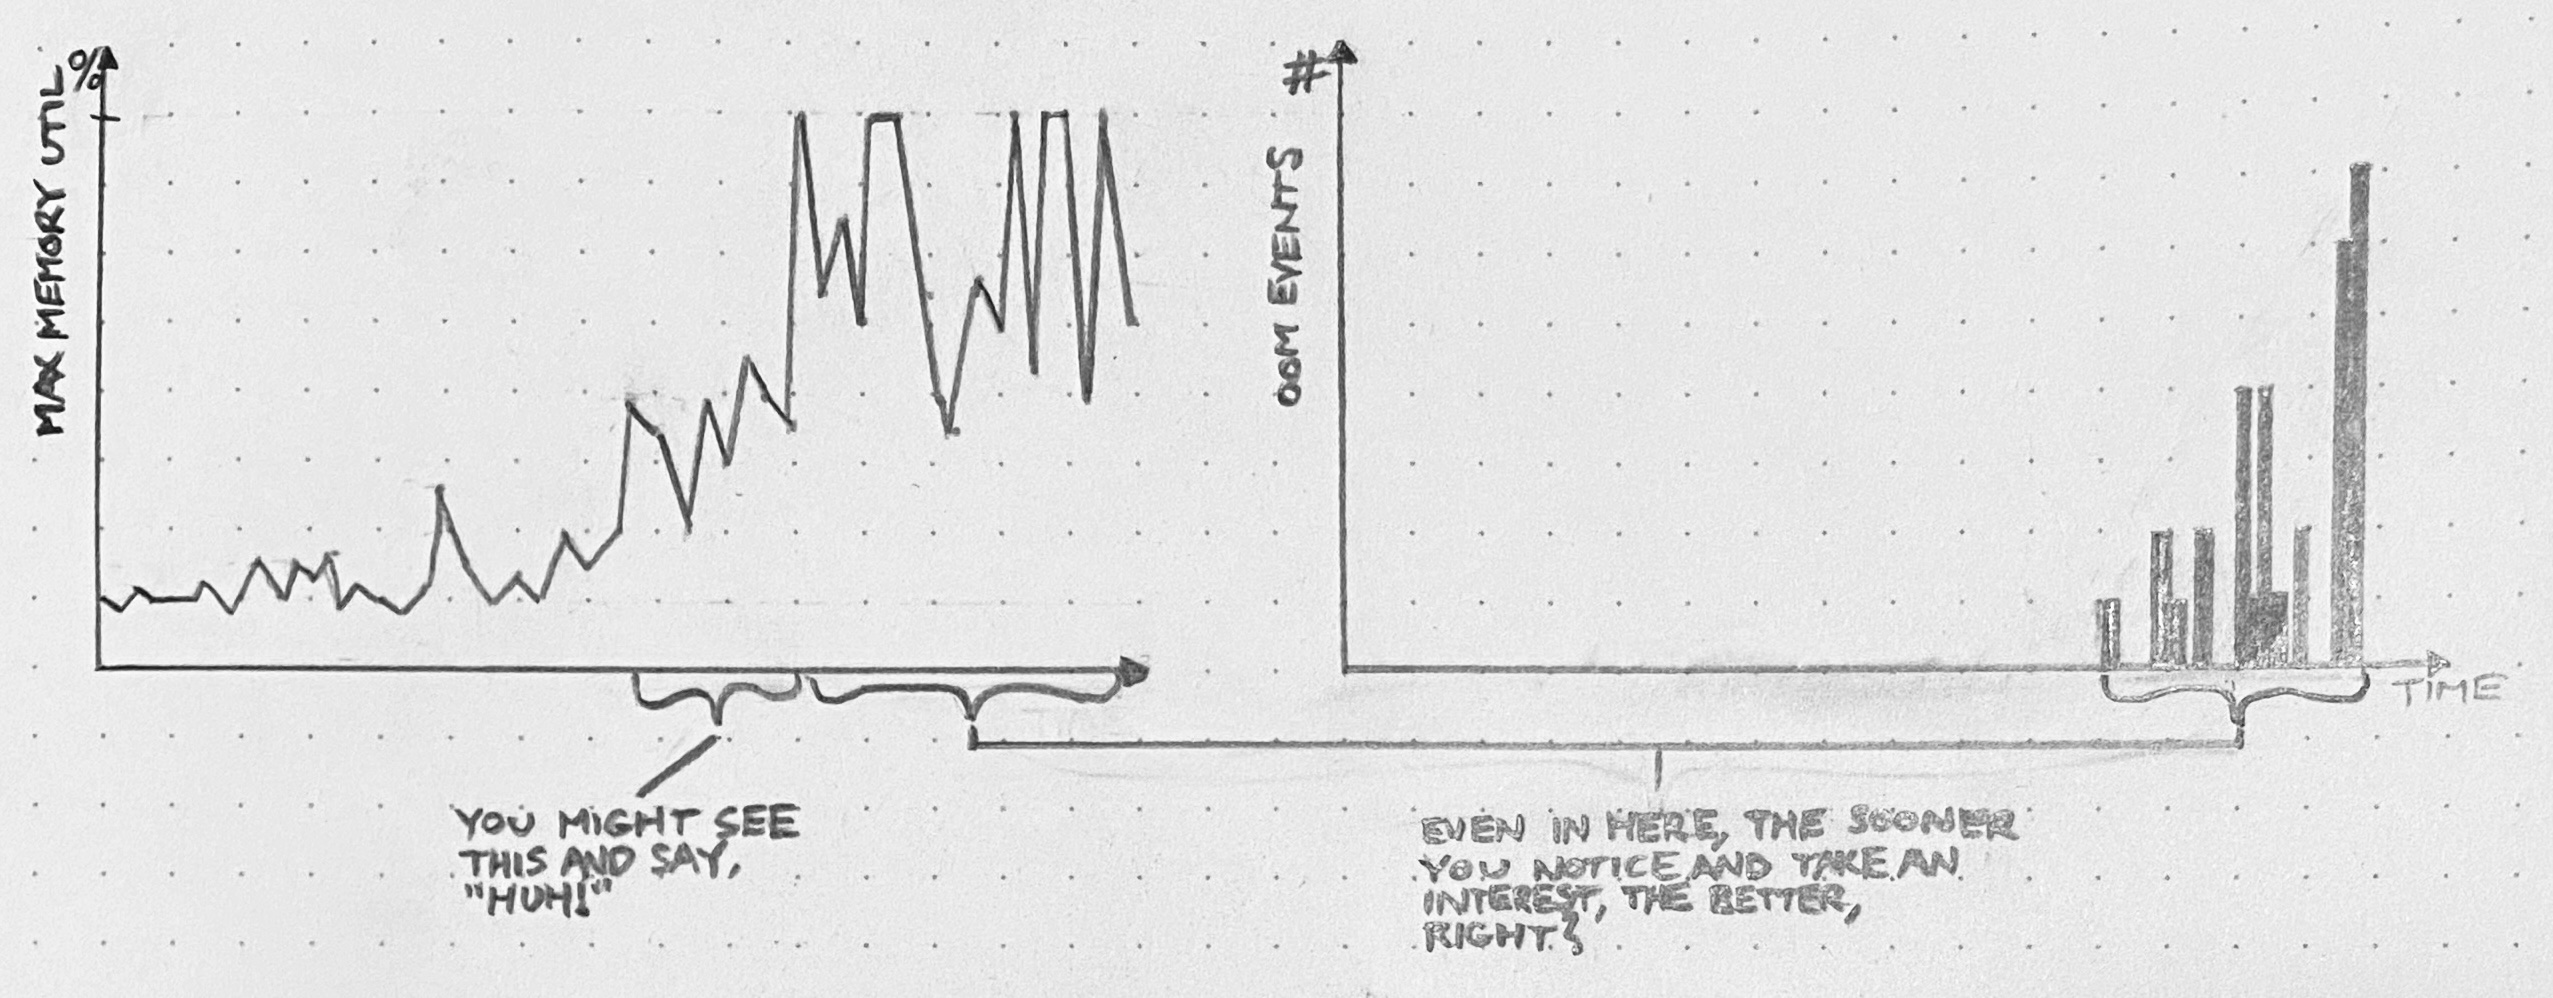
Excluding a behavior also makes your system easier to troubleshoot! Suppose you’re hunting down a bug that manifests as sudden server process crashes in production. You might wonder if an out-of-memory condition could be to blame for this behavior. And so you might spend half a day scrolling through logs, trying to correlate OOM events with your crashes. Whereas, if you’ve excluded out-of-memory errors, then you can hop right over that whole entire rabbit hole. Haven’t been notified about any OOMs? Then there haven’t been any OOMs.
Here are some classes of behavior that you might choose to exclude:
- deadlocks
- out-of-memory crashes
- network timeouts between load balancer and web server
- 503 errors
- Nil-pointer exceptions
- database transactions longer than 30 seconds
- Go panics
It shouldn’t be hard to think of more.
Do you really have to eliminate every member of an excluded class? Can’t you make exceptions?
Sure you can make exceptions. Just make sure you document the reasoning for any exception you make.
Because another great thing you get out of excluded behaviors is a list of known vulnerabilities to failure. This list is worth its weight in gold as a tool for knowledge transfer activities, such as onboarding, planning, and architecture design.
After a while, you get kind of addicted to excluding behaviors. Each new exclusion makes your production system that much more boring.
And boring is how we like ’em.