A simple intervention against Ugh Fields

For a year and change, I’ve been using a home-grown, constantly evolving task-tracking system I call Impulse. Part of the deal with Impulse is this: when I think of something I need to get done, I write it down immediately and get back to whatever I was doing.

Later, the thing I wrote down gets merged into a workstream. A workstream is list of tasks in the order I intend to start them. My two main workstreams are work (stuff I’m getting paid for), and personal (stuff I’m not getting paid for).

Impulse’s central principle, which is both obvious and, for me, life-altering, is that the more time you spend doing a thing, the more of that thing you will get done. Sure, there are other variables that play a role in determining output – focus, effectiveness of planning, and a match between your skill set and the work you undertake, to name a few – but time spent working is the most important.

Consequently, I try to arrange my life so as to allot some time every day to working through the tasks in my workstreams. I work from top to bottom, in whatever order the tasks are in at the time I start.

Among the myriad benefits this system has brought to my life is that it mitigates the effect of Ugh Fields.

Ugh Fields

An ugh field is a flinch response to thinking about a given domain of life, conditioned over time through repeated, self-reinforcing negative associations.

For example, I’ve long had an ugh field (or, as I’ve called it before, an attentional sneeze) around replying to texts from my family. I won’t go into how this ugh field developed. It wasn’t my family’s fault; they’re great. Point is, every time I thought about family texts I needed to reply to, my mind would flinch away. Over time, this flinch came earlier and earlier, and with less of a connection to any real source of discomfort. It grew through a feedback loop: think about the texts, flinch away, accrue consequences for ignoring them, think about those consequences, flinch earlier and more forcefully next time.

By succumbing to this ugh field, I’ve done significant damage to my relationship with my family. But the damage is not irreparable, and Impulse is helping me repair it.

Attenuating the ugh field

How can a simple task management system help repair years’ worth of self-conditioning? The key is to decouple the commitment to do a thing from the doing of the thing.

Time was, I didn’t have anywhere in particular to keep track of my plans and obligations. When it occurred to me that something needed doing (e.g. “read that my friend sent me”, “paint the railing on the back steps”, “reply to Dad about getting together in August”), I either had to do the thing right then, or remember to do it later. Thanks to attention deficit, this choice constitutes a dilemma. If I do the thing now, then I’ll lose track of what it was I was doing right beforehand. But if I decide to do the thing later, I’ll almost certainly forget to do it.

Now I have a third choice: record the task in my “inbox.” No matter how trivial it seems, just record it for now and get back to whatever I was doing. Later, on a recurring basis, merge the inbox into my personal and work workstreams.

Right off the bat, this helps. When I think of something I need to do, I don’t need to act on that thought right away. In fact I shouldn’t: that would distract me from whatever I’m already doing. I don’t have to feel bad about putting the thing off, so I don’t have so much of a flinch response.

Then, when it comes time to merge the tasks from my inbox (which is a Google Keep note) into the personal and work workstreams, there’s no longer an ugh field to overcome. I just put each task somewhere on the list, depending on how soon I want to get around to it. Here, another benefit kicks in: I’m forced to compare any new tasks to the other tasks I’ve committed to do, on equal footing.

Work’s just work

Because I’m comparing each task to all the others on a single dimension (i.e. where in the execution order to slot it), instead of a flinch-inducing dreaded obligation, I now just have another piece of work that will take a certain amount of time and create a certain amount of value. Like any other task, there are only 2 ways to get it off the list:

  1. Spend time doing it, or
  2. Decide consciously not to do it.

Either outcome is fine. What matters is that, instead of flinching away from even considering a task, I end up having an explicit conversation with myself about whether and when to do it. This lets me make better decisions.

This benefit is compounded by the way I burn down the workstreams. Somewhere in my day plan, there’s always some scheduled “heads down time,” during which I will execute tasks in a given workstream. For example, starting at 3pm today, I’ll do personal tasks. Always starting from the top of the list.

This means there’s no time to dread the ugh tasks. I don’t have to worry about whether I’m choosing the best thing to work on at a given moment, or what’s next afterward. I just have to trust the commitment I’ve already made to myself and do things in the order I’ve agreed to do them. The deciding is decoupled from the doing, which is an enormous help.

If you’ve come up with a similar arrangement, or if you’ve solved this problem for yourself in a different way, I’d love to hear about it! Hit me up in the comments.

Ticket Cutoff Ages Are Silly

CHARLIE:   There are too many tickets in our backlog!
JULIET:       I know, right? So many of them are old-ass feature requests that’ll never get done.
MIKE:          I’ve got an idea! Why don’t we auto-delete tickets older than 6 months?

(Everyone looks at each other in shock. Confetti wipe. MIKE is being carried through the office to thunderous applause.)

A maximum ticket age seems like a good idea. Big ticket backlogs are demoralizing, and it’s impossible to get any useful information out of them. Furthermore, we know with certainty that most things in the backlog are never getting done.

The submitter of a ticket knows more about why a piece of work is important than you do, right? Why not rely on that knowledge for triage?

No. Ticket cutoff ages are silly.

Ticket cutoff ages are silly because they rest on the assumption that a reporter will notice a ticket has been closed, read the notification, evaluate the ticket’s importance in the appropriate context, and reopen the ticket if – and only if – it’s important. This assumption is wildly flawed, as anyone with an inbox full of JIRA updates can attest. The evaluation step is especially absurd: how can ticket reporters be expected to consistently place requested work in the context of your team’s ever-shifting priorities and constraints?

Ticket cutoff ages are silly because the age of a ticket is a terrible proxy metric for value. There’s a crucial difference between urgent and important. Tasks that get resolved at a young age tend to be urgent ones, which are usually associated with achieving someone else’s goals. By enforcing a maximum age, your team will naturally focus on urgent tickets to the exclusion of important ones: generally those that advance the team’s goals. A ticket’s age has little connection with its importance.

Ticket cutoff ages are silly because they don’t even solve the problem they set out to solve: that demoralizing, disorganized pile of work that’s always in your peripheral vision. Sure, some tickets get closed, but you can never explain why. Important tasks disappear according to the whims of entropy, and unimportant tasks are always mixed in with everything else. Each time you try to understand your team’s commitments, you must reevaluate the merits of every ticket in the queue.

This method of constraining a ticket backlog is nothing short of an abdication of ownership. Instead of respecting our own time and that of the ticket reporter by making an explicit, up-front decision about a ticket’s fate, we let chance and frustration shape our product.

Wouldn’t it be better to take matters into our own hands and cap the backlog?

Cap Your Ticket Backlog

Unbounded ticket backlogs are one of the most pernicious influences facing an engineering team. Consider:

  • A team’s capacity (the amount of work it’s capable of doing in a given week) is limited. As the ticket backlog grows, so grows the number of tasks that will never be finished.
  • Keeping tickets that will never be finished amounts to a tacit denial of the team’s limited capacity. It’s pure fantasy to imagine that every ticket in the backlog is one that the team might eventually get around to.
  • Keeping tickets that will never be finished hides information about the team’s capacity and agenda, making it near impossible to reason about priorities. A giant backlog offers no information about what the team considers important, and it invites stakeholders to share in the delusion that all work will eventually get done.
  • A large ticket backlog is just demotivating. No one even contemplates digging into the backlog because of how Sisyphean that would feel.
  • To top it all off, a large, unbounded ticket backlog perpetuates itself. The more tickets you have, the less empowered you feel to say no.

Why ticket backlogs grow

Like any queueing system, a ticket backlog will grow without bound if tasks arrive faster (on average) than they leave.

Every engineering team has more ideas than time. There are many things that your team should probably do, but you’ll never have enough time to do them all. Add to this the firehose of feature requests, bug reports, and maintenance tasks, and it’s easy to see why tickets arrive in a backlog like… well… a firehose.

But we already know where tickets come from. That’s only one of two important variables. Why don’t tickets ever leave faster than they arrive?

Because we refuse to close them, of course! When a ticket represents a neat idea our team had, we don’t want to close it because the idea is still neat. And when it represents a request from a different team, we don’t feel empowered to close it because we feel it’s our team’s job to fulfill that request.

So tickets enter our system faster than we get rid of them. This usually leads to one of two situations:

  1. Growth without bound. Your ticket queue has 4000 tickets in it, and it’s become a running joke on the team that “oh sure, we’ll get around to it when we finish the rest of the ticket queue.” Sound familiar?
  2. Automatic closing. You write a cron job to auto-close tickets that haven’t been touched in a year, on the assumption that “if it’s important, they’ll re-open it.” Instead of making informed, thoughtful decisions about what work is most important to your team, you leave the problem to the vagaries of ticket reporters and the march of entropy.

It doesn’t have to be like this. But the solution is so obvious that most people will dismiss it out of hand.

Cap your ticket backlog.

Letting your backlog grow without bound is a form of information hiding. It serves only to obfuscate. So why not just cap its size? Say “from now on, there can’t be more than 10 tickets sitting in our backlog.”

Think of all the benefits:

  • You’ll force yourself to make decisions about which tasks are critical to your team’s success.
  • You’ll develop a sense of how much work you can realistically commit to.
  • You’ll know at a glance which types of tasks are in most dire need of streamlining.
  • You’ll understand, all at once and without summarizing, what’s in the backlog.
  • You’ll start looking at the backlog and thinking “I can put a dent in that.”

At first it will be hard to come to terms with the fact that most of the things in your backlog are never going to get done. But that’s a fact. The sooner you accept it, the better for everyone: not just your team, but also the people who make requests of you. It doesn’t serve anyone to pretend that you can finish every piece of work that would be nice to do.

Putting it into practice

My team at Etsy has started capping its backlog at 10 issues.

Each Tuesday morning, we meet in Slack for 15 minutes. We look at a JIRA filter that shows all unassigned tickets that haven’t been updated in the last 2 days. If there are more than 10, we prune the list.

There are a bunch of different ways we can remove a ticket from the backlog, including:

  • Mark for clobbering. Apply the label clobbering-time to an issue. This adds it to the list of issues that we’ll draw from during a Clobbering Time session. Clobbering Time is a monthly event where we try to knock out as many non-urgent tasks as possible. As such, Clobbering Time issues should be resolvable by a single engineer within an hour.
  • Move to another project. If it’s not a thing our team needs to do, move the ticket to the appropriate project.
  • Assign to someone. If someone’s ready to work on the issue immediately, assign it to that person.
  • Request more details. If the issue isn’t clearly defined enough to begin work, assign it to the creator and request more details. Make sure to un-assign the issue once enough details are received.
  • Close. Just close outright, with a comment explaining that we don’t have enough bandwidth.

At first, we found a lot of low-hanging fruit. There were many clobbering-friendly tickets we could remove immediately, and there were many others that simply were no longer relevant.

As we use this process more, we’re going to start having to make tougher decisions. We’ll have to choose between tasks that seem equally essential. It won’t always be pleasant, but I believe it’s necessary and we’ll be glad we did it, because ignoring those difficult decisions is worse.

Troubleshooting On A Distributed Team Without Losing Common Ground

I work on a team that fixes complex systems under time pressure. My teammates have different skill sets, different priorities, and different levels of expertise. But we all have to troubleshoot and solve problems together.

This is really hard to do effectively. Fortunately for us in the relatively new domain of DevOps, situations like ours have been studied extensively in the last couple decades. We can use the results of this research to inform our own processes and automation for troubleshooting.

One of the most important concepts to emerge from recent teamwork research, common ground, helps us understand why collaborative troubleshooting breaks down over time. This breakdown leads to wasted effort and mistakes, even if the team maintains constant communication in a chat room. But if we extend ChatOps by drawing on some ideas from medical diagnosis, we can make troubleshooting way easier without losing the benefits of fluid team conversation.

Common Ground

Ergonomics researchers D.D. Woods and Gary Klein (the latter of whom I wrote about in What makes an expert an expert?) published a phenomenally insightful paper in 2004 called Common Ground and Coordination in Joint Activity. In it, they describe a particular kind of failure that occurs when people engage in joint cognition: the Fundamental Common Ground Breakdown. Once you learn about the Fundamental Common Ground Breakdown, you see it everywhere. Here’s how the Woods/Klein paper describes the FCGB:

  • Party A believes that Party B possesses some knowledge
  • Party B doesn’t have this knowledge, and doesn’t know he is supposed to have it.
  • Therefore, he or she doesn’t request it.
  • This lack of a request confirms to Party A that Party B has the knowledge.

When this happens, Party A and Party B lose common ground, which Woods & Klein define as “pertinent knowledge, beliefs and assumptions that are shared among the involved parties.” The two parties start making incorrect assumptions about each other’s knowledge and beliefs, which causes their common ground to break down further and further. Eventually they reach a coordination surprise, which forces them to re-synchronize their understanding of the coordinated activity:

csel_eng_ohio-state_edu_woods_distributed_CG_final_pdf

Seriously, the FCGB is everywhere. Check out the paper.

I’m especially interested in one particular area where an understanding of common ground can help us do better teamwork: joint troubleshooting.

Common Ground Breakdown in Chatroom Troubleshooting

Everybody’s into ChatOps these days, and I totally get it. When a critical system is broken, it’s super useful to get everybody in the same room and hash it out. ChatOps allows everybody to track progress, coordinate activities, and share results. And it also helps to have lots of different roles represented in the room:

  • Operations folks, to provide insight into the differences between the system’s normal behavior and its current state
  • Software engineers, who bring detailed knowledge of the ways subsystems are supposed to work
  • Account managers and product managers and support reps: not just for their ability to translate technical jargon into the customer’s language for status reporting, but also because their understanding of customer needs can help establish the right priorities
  • Q.A. engineers, who can rule out certain paths of investigation early with their intuition for the ways in which subsystems tend to fail

The process of communicating across role boundaries isn’t just overhead: it helps us refine our own understanding, look for extra evidence, and empathize with each other’s perspectives.

But ChatOps still offers a lot of opportunities for common ground breakdown. The FCGB can occur whenever different people interpret the same facts in different ways. Interpretations can differ for many different reasons:

  • Some people have less technical fluency in the system than others. A statement like “OOM killer just killed Cassandra on db014” might change an ops engineer’s whole understanding of the problem, but such a shift could fly under the radar of, say, a support engineer.
  • Some people are multitasking. They may have a stake in the troubleshooting effort but be unable to internalize every detail from the chat room in real time.
  • Some people are co-located. They find it easier to discuss the problem using mouth words or by physically showing each other graphs, thereby adjusting their own shared understanding without transmitting these adjustments to the rest of the team.
  • Some people enter the conversation late, or leave for a while and come back. These people will miss common ground changes that happen during their absence.

These FCGB opportunities all become more pronounced as the troubleshooting drags on and folks become tired, bored, and confused. And when somebody says they’ve lost track of common ground, what do we do? Two main things: we provide a summary of recent events and let the person ask questions until they feel comfortable; or we tell them to read the backlog.

The Q&A approach has serious drawbacks. First of all, it requires somebody knowledgeable to stop what they’re doing and summarize the situation. If people are frequently leaving and entering the chat room, you end up with a big distraction. Second of all, it leaves lots of room for important information to get missed. The Fundamental Common Ground Breakdown happens when somebody doesn’t know what to ask, so fixing it with a Q&A session is kind of silly.

The other way people catch up with the troubleshooting effort is by reading the backlog. This is even more inefficient than Q&A. Here’s the kind of stuff you have to dig through when you’re reading a chat backlog:

tng-hipchat

There’s a lot to unpack there – and that’s just 18 messages! Imagine piecing together a troubleshooting effort that’s gone on for hours, or days. It would take forever, and you’d still make a lot of mistakes. It’s just not a good way to preserve common ground.

So what do we need?

Differential Diagnosis as an Engine of Common Ground

I’ve blogged before about how much I love differential diagnosis. It’s a formalism that doctors use to keep the diagnostic process moving in the right direction. I’ve used it many times in ops since I learned about it. It’s incredibly useful.

In differential diagnosis, you get together with your team in front of a whiteboard – making sure to bring together people from a wide variety of roles – and you go through a cycle of 3 steps:

  1. Identify symptoms. Write down all the anomalies you’ve seen. Don’t try to connect the dots just yet; just write down your observations.
  2. Generate hypotheses. Brainstorm explanations for the symptoms you’ve observed. This is where it really helps to have a good cross-section of roles represented. The more diverse the ideas you write down, the better.
  3. Test hypotheses. Now that you have a list of things that might be causing the problem, you start narrowing down that list by coming up with a test that will prove or disprove a certain hypothesis.

Once you’re done with step #3, you can cross out a hypothesis or two. Then you head back to step #1 and repeat the cycle until the problem is identified.

A big part of the power of differential diagnosis is that it’s written down. Anybody can walk into the room, read the whiteboard, and understand the state of the collaborative effort. It cuts down on redundant Q&A, because the most salient information is summarized on the board. It eliminates inefficient chat log reading – the chat log is still there, but you use it to search for specific pieces of information instead of reading it like a novel. But, most importantly, differential diagnosis cuts down on fundamental common ground breakdowns, because everybody has agreed to accept what’s on the whiteboard as the canonical state of troubleshooting.

Integrating Differential Diagnosis with ChatOps

We don’t want to lose the off-the-cuff, conversational nature of ChatOps. But we need a structured source of truth to provide a point-in-time understanding of the effort. And we (read: I) don’t want to write a whole damn software project to make that happen.

My proposal is this: use Trello for differential diagnosis, and integrate it with the chat through a Hubot plugin. I haven’t written this plugin yet, but it shouldn’t take long (I’ll probably fork hubot-trello and start from there). That way people could update the list of symptoms, hypotheses, and tests on the fly, and they’d always have a central source of common ground to refer to.

In the system I envision, the chat room conversation would be peppered with statements like:

Geordi: hubot symptom warp engine going full speed, but ship not moving

Hubot: Created (symp0): warp engine going full speed, but ship not moving

Beverly: hubot falsify hypo1

Hubot: Falsified (hypo1): feedback loop between graviton emitter and graviton roaster

Geordi: hubot finish test1

Hubot: Marked (test1) finished: reboot the quantum phase allometer

And the resulting differential diagnosis board, containing the agreed-upon state of the troubleshooting effort, might look like this example, with cards labeled to indicate that they’re no longer in play.

What do you think?

Let me know if your organization already has something like this, or has tried a formal differential diagnosis approach before. I’d love to read some observations about your team’s process in the comments. Also, VictorOps has a pretty neat suite of tools that approaches what I have in mind, but I still think a more conceptually structured (not to mention free) solution could be very useful.

Automation is most effective when it’s a team player. By using automation to preserve common ground, we can solve problems faster and more thoroughly, with less frustration and less waste. And that all sounds pretty good to me.

When efficiency hurts more than it helps

When we imagine how to use a resource effectively – be that resource a development team, a CPU core, or a port-a-potty – our thoughts usually turn to efficiency. Ideally, the resource gets used at 100% of its capacity: we have enough capacity to serve our needs without generating queues, but not so much that we’re wasting money on idle resources. In practice there are spikes and lulls in traffic, so we should provision enough capacity to handle those spikes when they arrive, but we should always try to minimize the amount of capacity that’s sitting idle.

Except what I just said is bullshit.

In the early chapters of Donald G. Reinertsen’s brain-curdlingly rich Principles of Product Development Flow, I learned a very important and counterintuitive lesson about queueing theory that puts the lie to this naïve aspiration to efficiency-above-all-else. I want to share it with you, because once you understand it you will see the consequences everywhere.

Queueing theory?

Queueing theory is an unreasonably effective discipline that deals with systems in which tasks take time to get processed, and if there are no processors available then a task has to wait its turn in a queue. Sound familiar? That’s because queueing theory can be used to study basically anything.

In its easiest-to-consume form, queueing theory tells us about average quantities in the steady state of a queueing system. Suppose you’re managing a small supermarket with 3 checkout lines. Customers take different, unpredictable amounts of time to finish their shopping. So they arrive at the checkout line at different intervals. We call the interval between two customers reaching the checkout line the arrival interval.

And customers also take different, unpredictable amounts of time to get checked out. The time it takes from when the cashier scans a customer’s first item to when they finish checking that customer out is called the processing time.

Each of these quantities has some variability in it and can’t be predicted in advance for a particular customer. But you can empirically determine the probability distribution of these quantities:

distributions

Given just the information we’ve stated so far, queueing theory can answer a lot of questions about your supermarket. Questions like:

  • How long on average will a customer have to wait to check out?
  • What proportion of customers will arrive at the checkout counter without having to wait in line?
  • Can you get away with pulling an employee off one of the registers to go stock shelves? And if you do that, how will you know when you need to re-staff that register?

These sorts of questions are super important in all sorts of systems, and queueing theory provides a shockingly generalizable framework for answering them. Here’s an important theme that shows up in a huge variety of queueing systems:

The closer you get to full capacity utilization, the longer your queues get. If you’re using 100% of capacity all time, your queues grow to infinity.

This is counterintuitive but absolutely true, so let’s think through it.

What happens when you have no idle capacity

What the hell? Isn’t using capacity efficiently how you’re supposed to get rid of queues? Well yes, but it doesn’t work if you do it all the time. You need some buffer capacity.

Let’s think about a generic queueing system with 5 processors. This system’s manager is all about efficiency, so the system operates at 100% capacity all the time. No idle time. That’s ideal, right?

fullcap-0

Sure, okay, now what happens when a task gets completed? If we want to make sure we’re always operating at 100% capacity, then there needs to be a task waiting behind that one. Otherwise we’d end up with an idle processor. So our queueing system must look more like this:

fullcap-1

In order to operate at 100% capacity all the time, we need to have at least as many tasks queued as there are processors. But wait! That means that when another new task arrives, it has to get in line behind those other tasks in the queue! Here’s what our system might look like a little while later:

fullcap-2

Some queues may be longer than others, but no queue is ever empty. This forces the total number of items in the queue to grow without limit. Eventually our system will look like this:

fullcap-3

If you don’t quite believe it, I don’t blame you. Go back through the logic and convince yourself. It took me a while to absorb the idea too.

What this means for teams

You can think of a team as a queueing system. Tasks arrive in your queue at random intervals, and they take unpredictable amounts of time to complete. Each member of the team is a processor, and when everybody’s working as hard as they can, the system is at 100% capacity.

That’s what a Taylorist manager would want: everybody working as hard as they can, all the time, with no waste of capacity. But as we’ve seen, in any system with variability, that’s an unachievable goal. The closer you get to full capacity utilization, the faster your queues grow. The longer your queues are, the longer the average task waits in the queue before getting done. It gets bad real fast:

Quartz_3____

So there are very serious costs to pushing your capacity too hard for too long:

  • Your queues get longer, which itself is demotivating. People are less effective when they don’t feel that their work is making a difference (see The Progress Principle)
  • The average wait time between a task arriving and a getting done rises linearly with queue length. With long wait times, you hemorrhage value: you commit time and energy to ideas that might not be relevant anymore by the time you get around to them (again: read the crap out of Principles of Product Development Flow)
  • Since you’re already operating at or near full capacity, you can’t even deploy extra capacity to knock those queues down: it becomes basically impossible to ever get rid of them.
  • The increased wait time in your ticket queue creates long feedback times, nullifying the benefit of agile techniques.

Efficiency isn’t the holy grail

Any queueing system operating at full capacity is gonna build up giant queues. That includes your team. What should you do about it?

Just by being aware that this relationship exists, you can gain a lot of intuition about team dynamics. What I’m taking away from it is this: There’s a tradeoff between how fast your team gets planned work done and how long it takes your team to get around to tasks. This changes the way I think about side projects, and makes me want to find the sweet spot. Let me know what you take away from it.

Kanban Highway: The Least Popular Mario Kart Course

I’ve been reading a really excellent book on product development called The Principles of Product Development Flow, by Donald G. Reinertsen. It’s a very appealing book to me, because it sort of lays down the theoretical and mathematical case for agile product development. And you know that theory is the tea, earl grey, hot to my Jean-Luc Picard.

But as much as I love this book, I just have to bring up this chart that’s in it:

terrible chart

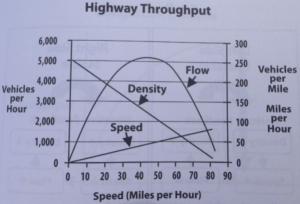
This is the Hindenburg of charts. I can’t even, and it’s not for lack of trying to even. Being horrified by the awfulness of this chart is left as an exercise for the reader, but don’t hold me responsible if this chart gives you ebola.

But despite the utter contempt I feel for that chart, I think the point it’s trying to make is very interesting. So let’s talk about highways.

Highways!

Highways need to be able to get many many people into the city in the morning and out of the city in the evening. So when civil engineers design highways, one of their main concerns is throughput, measured in cars per hour.

Average throughput can be measured in a very straightforward way. First, you figure out the average speed, in miles per hour, of the cars on the highway. The cars are all traveling different speeds depending on what lane they’re in, how old they are, etc. But you don’t care about all that variation: you just need the average.

The other thing you need to calculate is the density of cars on the highway, measured in cars per mile. You take a given length of highway, and you count how many cars are on it, then you repeat. Ta-da! Average car density.

Then you do some math:

\frac{cars}{hour} = \frac{cars}{mile} \cdot \frac{miles}{hour}

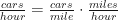
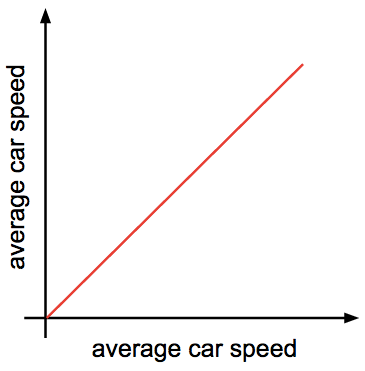
Easy peasy. But let’s think about what that means. Here’s a super interesting graph of average car speed versus average car speed:

speed vs speed

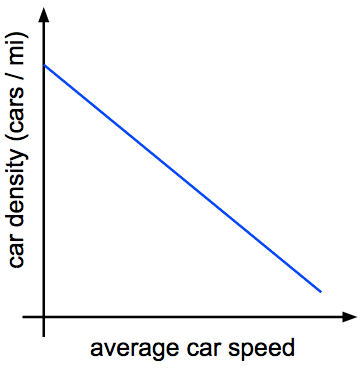
Stay with me. Here’s a graph of average car density versus average car speed:

density vs speed

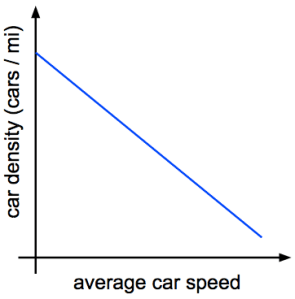
This makes sense, right? Cars tend to pack together at low speed. That’s called a bumper-to-bumper traffic jam. And when they’re going fast, cars tend to spread out because they need more time to hit the brakes if there’s a problem.

So, going back to our equation, what shape do we get when we multiply a linear equation by another linear equation? That’s right: we get a parabola:

throughput-vs-speed

That right there is the throughput curve for the highway (which in the real world isn’t quite so symmetric, but has roughly the same properties). On the left hand side, throughput is low because traffic is stopped in a bumper-to-bumper jam. On the right hand side, throughput is low too: the cars that are on the highway are able to go very fast, but there aren’t enough of them to raise the throughput appreciably.

So already we can pick up a very important lesson: Faster movement does not equate to higher throughput. Up to a point, faster average car speed improves throughput. Then you get up toward the peak of the parabola and it starts having less and less effect. And then you get past the peak, and throughput actually goes down as you increase speed. Very interesting.

Congestion

Now, looking at that throughput curve, you might be tempted to run your highway at the very top, where the highest throughput is. If you can get cars traveling the right average speed, you can maximize throughput thereby minimizing rush hour duration. Sounds great, right?

Well, not so fast. Suppose you’re operating right at the peak, throughput coming out the wazoo. What happens if a couple more cars get on the highway? The traffic’s denser now, so cars have to slow down to accommodate that density. The average speed is therefore reduced, which means we’re now a bit left of our throughput peak. So throughput has been reduced, but cars are still arriving at the same rate, so that’s gonna increase density some more.

congestion

This is congestion collapse: a sharp, catastrophic drop in throughput that leads to a traffic jam. It can happen in any queueing system where there’s feedback between throughput and processing speed. It’s why traffic jams tend to start and end all at once rather than gradually appearing and disappearing.

The optimal place for a highway to be is just a little to the right of the throughput peak. This doesn’t hurt throughput much because the curve is pretty flat near the top, but it keeps us away from the dangerous positive feedback loop.

So what does all this have to do with product development workflow?

Kanban Boards Are Just Like Highways

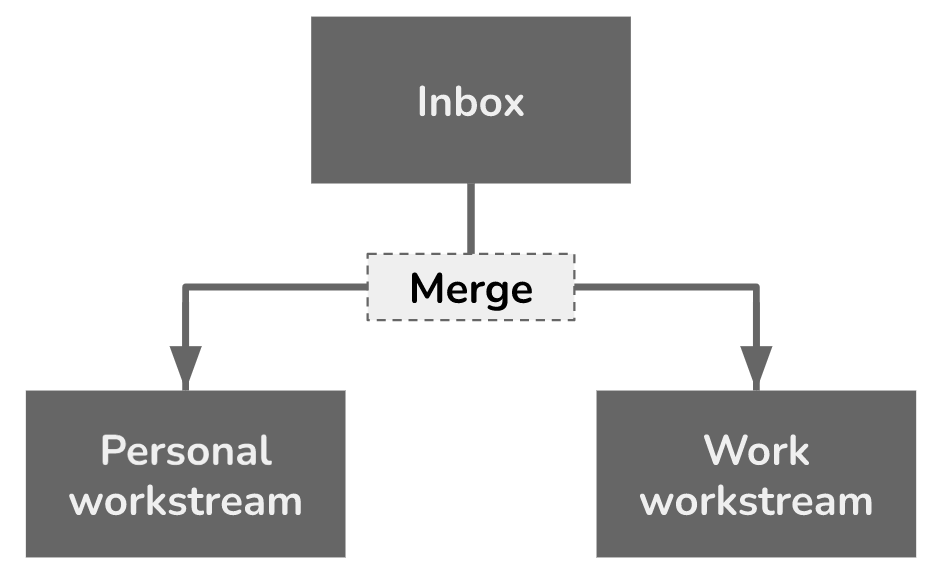
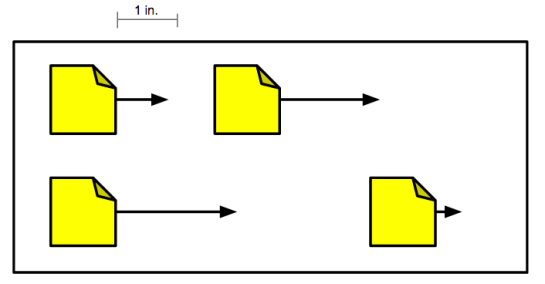
On a kanban board, tickets move from left to right as we make progress on them. If we had a kanban board where tickets moved continuously rather than in discrete steps, we could measure the average speed of tickets on our board in inches per day (or, if we were using the metric system, centimeters per kilosecond):

ticket-speed
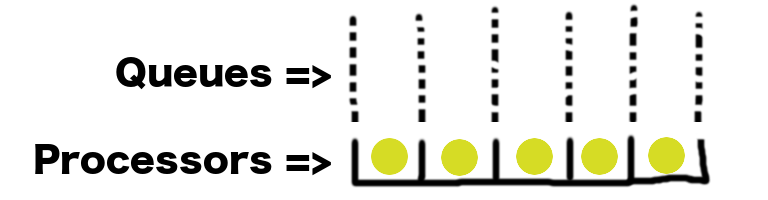
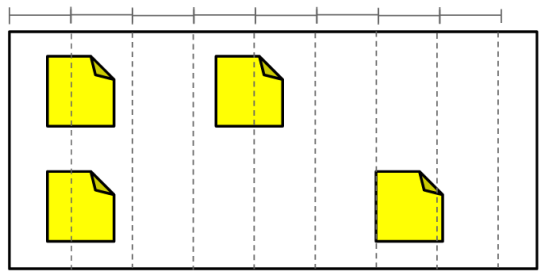
And we could also measure the density of tickets just like we measured the density of cars, by dividing the board into inch-wide slices and counting the tickets per inch:

tickets-per-inchLet’s see how seriously we can abuse the analogy between this continuous kanban board and a highway:

  • Tickets arrive in our queue at random intervals, just as cars pull onto a highway at random intervals.
  • Tickets “travel” at random speeds (in inches/day) because we’re never quite sure how long a given task is going to take. This is just like how cars travel at random speeds (in miles per hour)
  • Tickets travel more slowly when there are many tickets to do (because of context switching, interdependencies, blocked resources, etc.), just as cars travel more slowly when they’re packed more densely onto the highway.
  • Tickets travel more quickly when there are fewer tickets to do, just as cars travel more quickly when the road ahead of them is open.

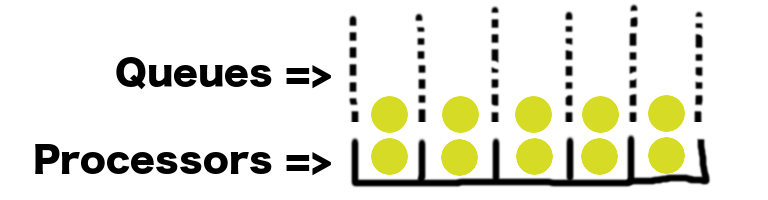
There are similarities enough that we can readily mine traffic engineering patterns for help dealing with ticket queues. We end up with a very familiar throughput curve for our kanban board:

ticket-throughput
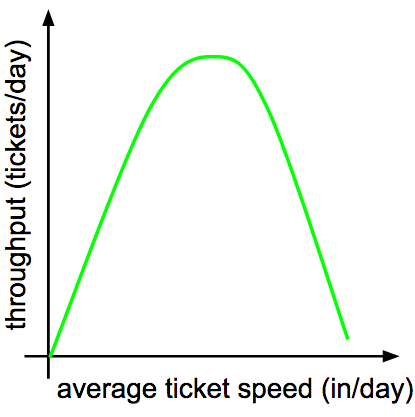
And just like with highway traffic, we run the risk of congestion collapse if we stray too close to the left-hand side of this curve. Since kanban boards generally have a limit on the number of tickets in progress, however, our congestion won’t manifest as a board densely packed with tickets. Rather, it will take the form of very long queues of work waiting to start. This is just as bad: longer queues mean longer wait times for incoming work, and long queues don’t go away without a direct effort to smash them.

What we can learn from real-world queues

A kanban board is a queueing system like any other, and the laws of queueing theory are incredibly general in their applicability. So we can learn a lot about managing ticket throughput by looking at the ways in which other queueing systems have been optimized.

Measure your system’s attributes

First off: you need metrics. Use automation to measure and graph, at the very least,

  • Number of tickets in queue (waiting to start work)
  • Number of tickets in progress
  • Number of tickets completed per day (or week)

Productivity metrics smell bad to a lot of people, and I think that’s because they’re so often used by incompetent managers as “proof” that employees could be pulling more weight. But these metrics can be invaluable if you understand the theory that they fit into. You can’t improve without measuring.

Control occupancy to sustain throughput

As we’ve seen, when there are too many tickets in the system, completion times suffer in a self-reinforcing way. If we’re to avoid that, we need to control the number of tickets not just in progress, but occupying the system as a whole. This includes queued tickets.

In some cities (Minneapolis and Los Angeles, for example), highway occupancy is controlled during rush hour by traffic lights on the on-ramp. The light flashes green to let a single car at a time onto the highway, and the frequency at which that happens can be tuned to the current density of traffic. It’s a safeguard against an abrupt increase in density shoving throughput over the peak into congestion collapse.

But how can we control the total occupancy of our ticketing system when tickets arrive at random?

Don’t let long queues linger

If you’re monitoring your queue length, you’ll be able to see when there’s a sharp spike in incoming tickets. When that happens, you need to address it immediately.

For every item in a queue, the average wait time for all work in the system goes up. Very long queues cause very long wait times. And long queues don’t go away by themselves: if tickets are arriving at random intervals, then a long queue is just as likely to grow as it is to shrink.

One way to address a long queue is to provision a bit more capacity as soon as you see the queue forming. Think about supermarkets. When checkout lines are getting a bit too long, the manager will staff one or two extra lanes. All it takes is enough capacity to get the queues back down to normal – it’s not necessary to eliminate them altogether – and then those employees can leave the register and go back to whatever they were doing before.

The other way to address a long queue is to slash requirements. When you see a long queue of tickets forming, spend some time going through it and asking questions like

  • Can this ticket be assigned to a different team?
  • Can this feature go into a later release?
  • Are there any duplicates?
  • Can we get increased efficiency by merging any of these tickets into one? (e.g. through automation or reduced context switching)

If you can shave down your queue by eliminating some unnecessary work, your system’s wait times will improve and the required capacity to mop up the queue will be lower.

Provide forecasts of expected wait time

At Disney World, they tell you how long the wait will be for each ride. Do you think they do this because it’s a fun little bit of data? Of course not. It helps them break the feedback loop of congestion.

When the wait for Space Mountain is 15 minutes, you don’t think twice. But when the wait is an hour, you might say to yourself “Eh, maybe I’ll go get lunch now and see if the line’s shorter later.” So these wait time forecasts are a very elegant way to cut down on incoming traffic when occupancy is high. Just like those traffic lights on highway on-ramps.

Why not use Little’s law to make your own forecasts of expected ticket wait time? If you’re tracking the occupancy of your system (including queued tickets) and the average processing rate (in tickets completed per day), it’s just:

\text{Average Wait Time} = \frac{\text{Occupancy}}{\text{Average Processing Rate}}

If you display this forecast in a public place, like the home page for your JIRA project, people will think twice when they’re about to submit a ticket. They might say to themselves “If it’s gonna take that many days, I might as well do this task myself” or “The information I’m asking for won’t be useful a week from now, so I guess there’s no point filing this ticket.”

Forecasts like this allow you to shed incoming ticket load when queues are high without having to tell stakeholders “no.”

Queues are everywhere

If you learn a little bit about queueing theory, you’ll see queues everywhere you look. It’s a great lens for solving problems and understanding the world. Try it out.