Owning a production Postgres database is never boring.
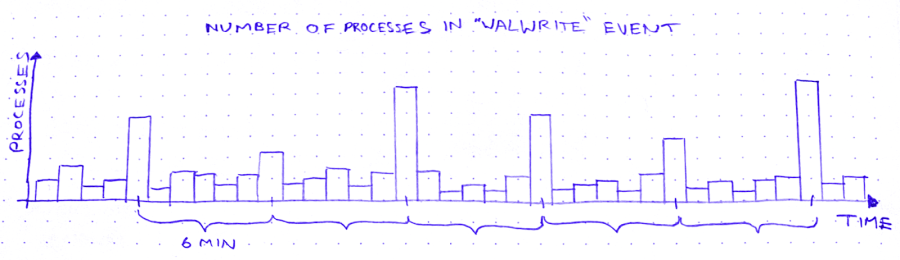
The other day, I’m looking for trouble (as I am wont to do), and I notice this weird curve in the production database metrics:

So we’ve got these spikes in WALWrite: the number of processes waiting to write to the write-ahead log (or “WAL”). The write-ahead log is written serially, so sometimes there’s contention for the mutex that lets you write to it. A queue forms.
But why does WALWrite spike periodically, every 6 minutes? Is this some cron job run amok? (*/6 * * * *? But then they’d only be 4 minutes apart at the hour boundaries…) Does a customer do some API request that updates a ton of records? Do I need to worry about this getting worse?
So I zoom out to see when the WALWrite spikes started:
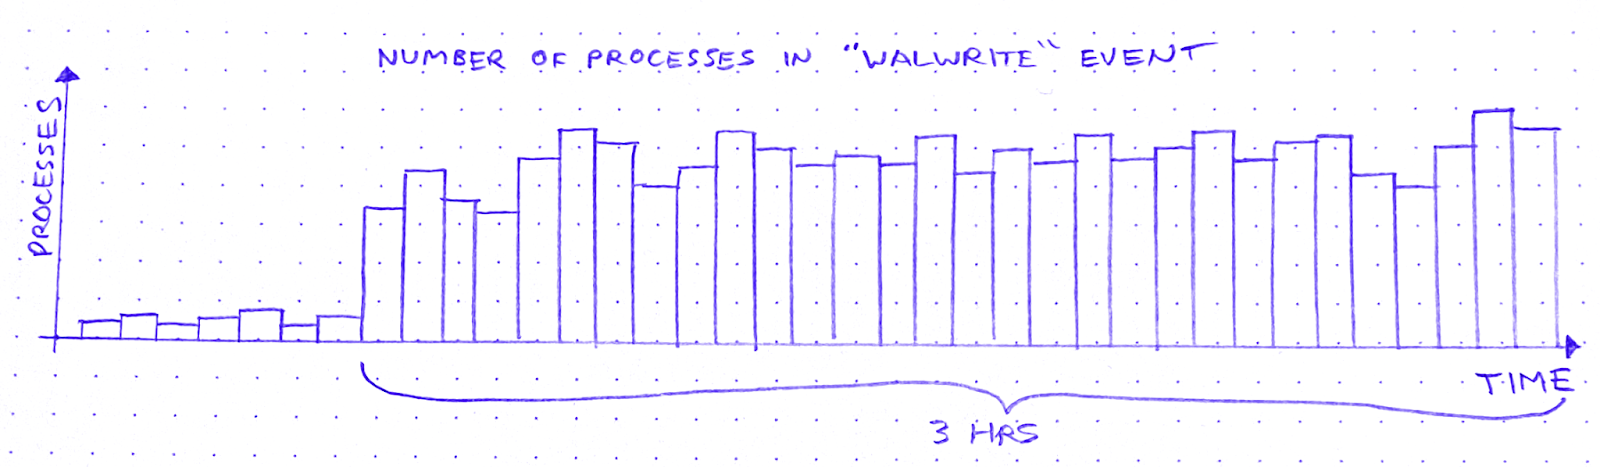
It started about 3 hours ago. Okay: what else started about 3 hours ago?
I scroll around looking at the database graphs. After about 15 minutes of highly scientific squinting and head-tilting, I’ve got two more graphs on my screen. The first is “Max transaction duration.” That is: the age of the oldest open transaction.

This is definitely related. It shares that 6-minute period, and the sawtooth pattern also started 3 hours ago. Great.
After a bit of digging and a brief Slack conversation, I know the reason for this sawtooth pattern. There’s an ongoing backfill into BigQuery via Datastream. As far as I can tell, what a Datastream backfill does, is it starts a transaction and then uses a cursor to page through the rows of the table. Something like:
BEGIN;
DECLARE curs CURSOR FOR SELECT * FROM table OFFSET ?;
OPEN curs;
FETCH FORWARD ? FROM curs INTO ?;
FETCH FORWARD ? FROM curs INTO ?;
/* ~6 minutes later */
ROLLBACK;
After about 6 minutes the transaction closes and a new transaction begins, with a new offset. Repeat until table is backfilled.
The other new graph is “pages dirtied” by a particular query:

Now I don’t know what “pages dirtied” means. I look up “dirty page” on Urban Dictionary, but it’s a miss. So I resort to Googling around for a while. I eventually land on this Cybertec blog post (there’s always a Cybertec post. God bless ’em), which demystifies shared buffers for me.
When Postgres needs to write to a page, it:
- Writes the change to the WAL
- Writes the change to a buffer, marking the buffer as dirty in the process
Then a process called the background writer comes along at some point later and writes the dirty buffer to disk. Great! So that’s what “pages dirtied” means.
Except – and this is wild – the particular query whose “pages dirtied” rate is shown in the graph above is, SELECT * FROM foo WHERE id = ?. Yes you read that right: SELECT. Now I’m no SQL expert, but I thought SELECT (absent a FOR clause) was a read-only operation. Right? So what’s this about writing?
In fact, come to think of it, the sawtooth workload from before – the Datastream backfill – was also a read-only workload. So, good news and bad news. The good news is I’ve identified 2 workloads that correlate closely to the WALWrite spikes I’m trying to explain. The bad news is: they’re both read-only workloads.
At this point I need a walk, so I put on my hat and coat and I stomp through slush to the coffee shop. I feel flummoxed, and I try to think about literally anything else – Cyberpunk 2077… the French Revolution… what I’m gonna make for dinner. Anything but Postgres.
So, a few minutes minutes later, I’m waiting in line at a coffee shop, reading Postgres StackOverflow posts on my phone. And I find this one. Cybertec again! These guys are everywhere. What I learn from this post is revelatory: SELECT queries in Postgres are not read-only. True, a SELECT can’t modify rows. But it can sure as hell modify tuples!
A tuple is basically a version of a row. When you UPDATE (or DELETE) a row, Postgres doesn’t just update the data in place. It creates a new tuple with the new data and adds that tuple to the heap. It also adds entries to any relevant indexes.
There is no “row” in the heap. There are only tuples. A SELECT query doesn’t just “fetch” a row. It fetches some number of tuples, determines which tuple is visible to the present transaction, and uses that tuple’s data to construct a row.
In order to make that visibility determination, Postgres needs to know, for each tuple fetched, whether the transaction that wrote that tuple has ended. It can determine this by referring to the commit log (pg_clog), but that involves disk reads, so it’s not very fast. Wouldn’t it be great if somehow we could cache the result of that pg_clog lookup so that subsequent queries can skip it?
Enter hint bits. When a SELECT checks pg_clog and determines that the transaction that wrote a tuple is closed, it sets a bit on that tuple. A “hint bit.” This way, subsequent SELECTs that fetch the same tuple won’t have to consult pg_clog.
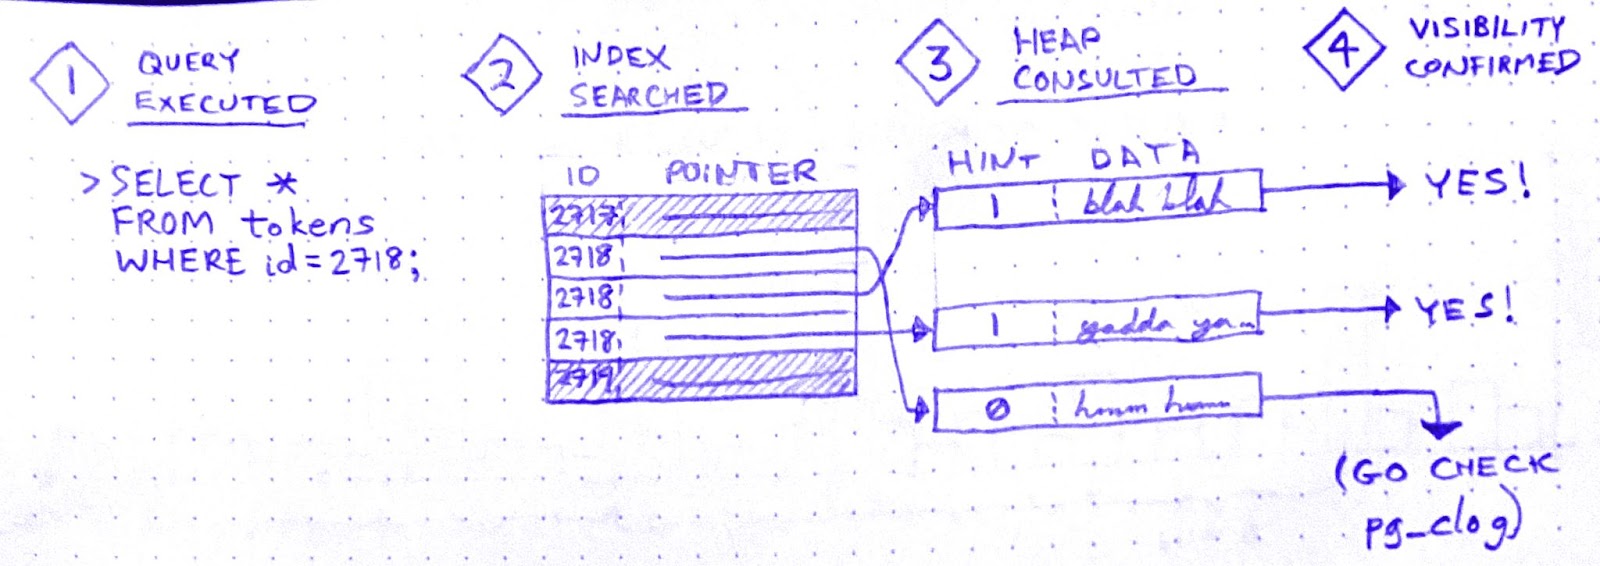
So it’s an optimization. But, if you’ve been paying attention, you now see why SELECTs in Postgres aren’t read-only: Setting a hint bit is a write. It dirties the page.
Aha! I’m starting to get a hypothesis here:
- Datastream starts a transaction in order to
SELECT * FROM foo - While the Datastream transaction is open, many
foorows areSELECTed andUPDATEd by other, concurrent transactions. - Therefore, while the Datastream transaction is open, many of the concurrent
SELECTs onfoomust fetch multiple tuples per row. Whenever they do, they encounter tuples written by the Datastream transaction - Datastream ends its transaction.
- All subsequent
SELECTs that encounter tuples written by the Datastream transaction will now update the hint bits for those tuples after seeing inpg_clogthat the transaction is closed.
But it doesn’t quite hang together yet. I still see two major cracks in this hypothesis:
(a) In (3): why has the Datastream transaction created tuples? That’s weird, right?
(b) And in (5): why does updating the hint bits cause contention for WAL writes? (by default, hint bit updates do not trigger a WAL write.)
Let’s do (b) first. That’s easier.
When recovering from a crash, Postgres starts from a checkpoint: a WAL entry representing an instant at which all data is up to date on disk. Then it replays all subsequent WAL changes against the data pages on disk. In order for this to work, the pages on disk must be internally consistent.
How could a page become internally inconsistent, you say? Torn writes. That’s when part of the page is written to disk, but before the next write() call can finish writing the page to disk, the system crashes. If a page on disk is “torn,” crash recovery can’t proceed. That’s why Postgres has a setting called full_page_writes, which is on by default. With full_page_writes on, the first time a page is dirtied after a checkpoint, that page is written in its entirety to the WAL.
This explains why updating hint bits caused a run on the WAL. In fact, when I raise the interval between checkpoints, the WALWrite spikes disappear.
Hooray!
But what about (a)? Why would the Datastream backfill create tuples? If it doesn’t create tuples, this whole hypothesis becomes untenable.
Well, sorry to disappoint you, but I don’t know why – or even whether – the Datastream backfill creates tuples. Perhaps it doesn’t, and my hypothesis is wrong. If you have an alternative hypothesis, please comment!
Ops is like this a lot of the time. Once you get a working fix, you move on to whatever’s the next biggest source of anxiety. Sometimes you never get a fully satisfying “why.” But you can still love the chase.