One piece of common-sense advice that you often hear about incident response is,
Fix it first. Ask “why” later.
This chestnut is often deployed to combat what is perceived as excessive investigation. And like most common-sense advice, it’s approximately right in lots of situations. But it misses a crucial point, and at its worst, this attitude perpetuates failure.
Diagnosing and fixing can involve overlapping activities, such that they blend together during incident response. For example, if you have diagnosed a partial outage as resulting from a web server that’s used up all its allotted file handles, you might restart that web server. This would be a “diagnostic intervention,” in that it serves to advance both the fix (if your diagnosis holds water, then restarting the web server will fix the problem) and the diagnosis (if restarting the web server fixes the problem, then you have additional evidence for your diagnosis; if it doesn’t, then you know you need a new diagnosis).
The fact that fixing and diagnosing often converge to the same actions doesn’t change the fact that these two concurrent activities have different goals. The goal of fixing is to bring the system into line with your mental model of how it’s supposed to function. The goal of diagnosing is to bring your mental model into line with the way the system is actually behaving.
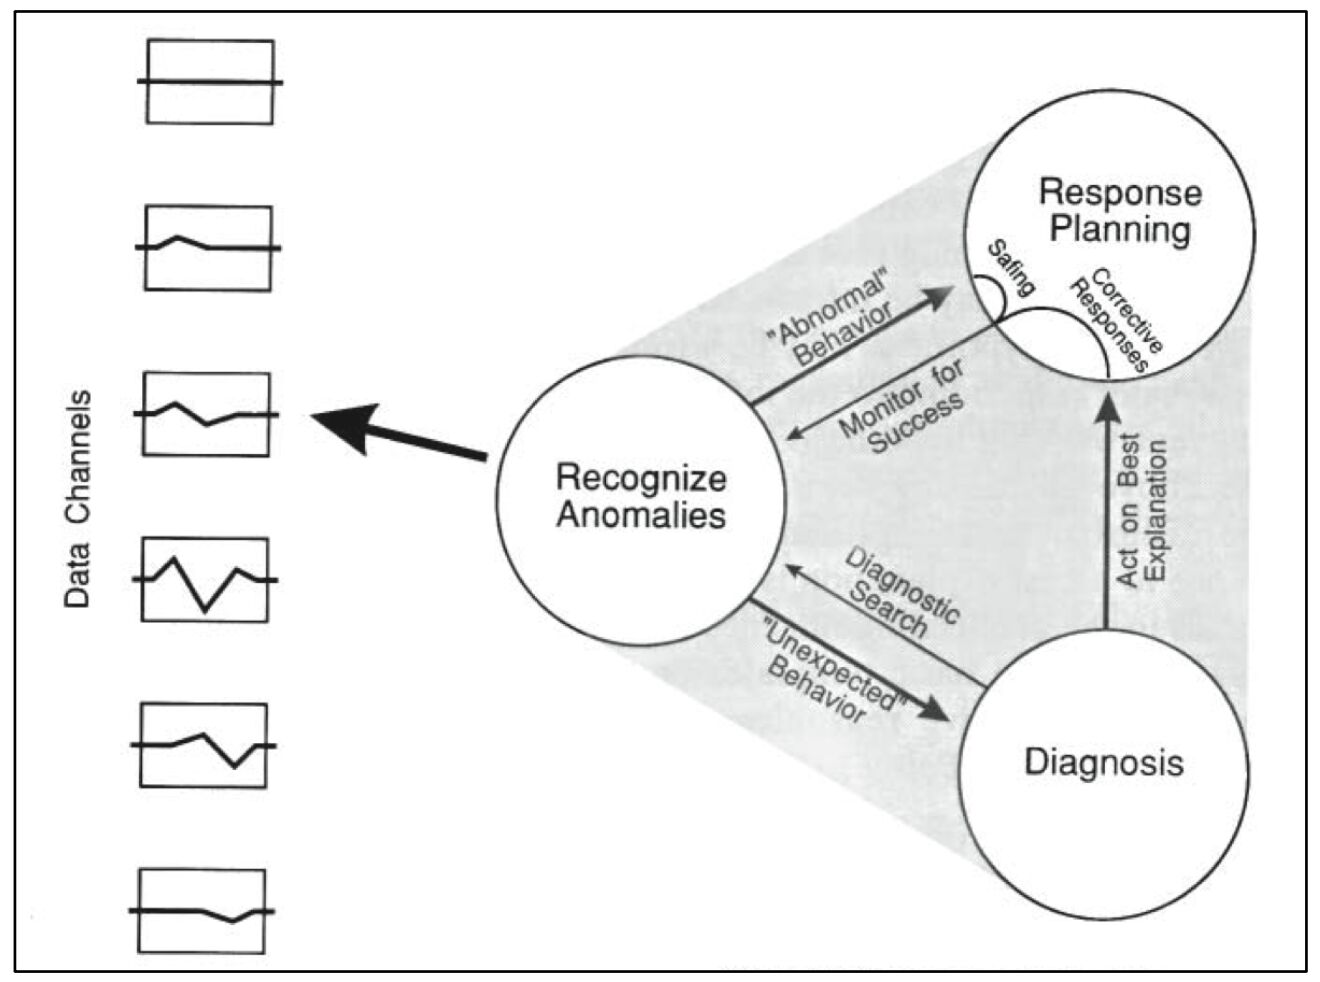
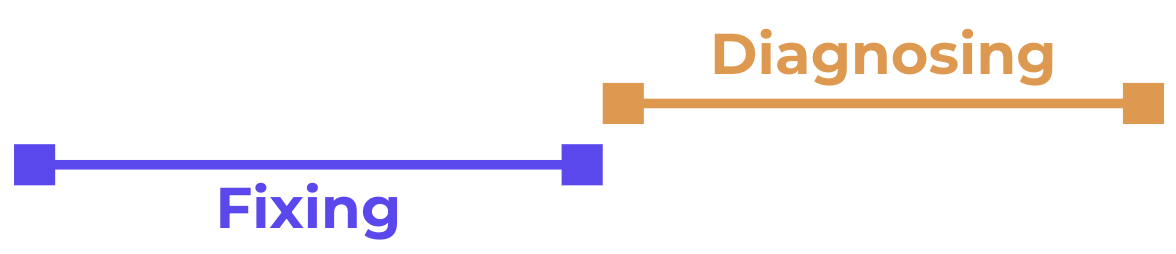
Usually these two goals are aligned with one another, but sometimes they demand different actions. And that’s what opens the door for someone to say, “Let’s fix the problem first and ask questions later.” However, this implies a naïve conception of the incident response process, which I’ll represent schematically here:
In this view, you fix first, then you diagnose – perhaps in a post-mortem or a root-cause analysis. But in a field like ours, in which complex systems are at play, this is simply not how things work. A complex system has infinitely many possible failure modes. Therefore there are infinitely many possible actions that might be necessary to recover from a failure. In order to even attempt a fix, you must always start with some kind of diagnosis.
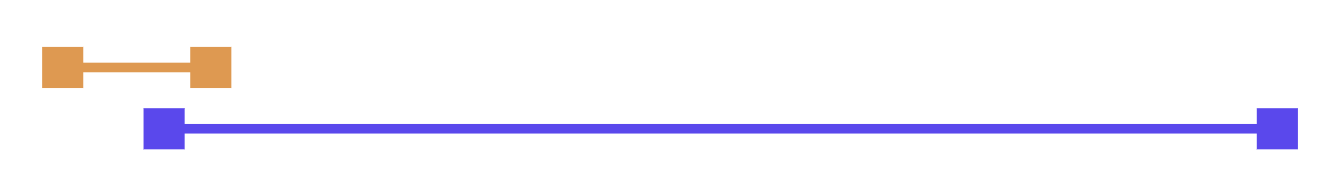
Sure, sometimes the diagnostic effort might be very brief and straightforward. Suppose you get an alert about some new error happening in production. You immediately recognize the error as resulting from a code change you just deployed, and you revert the change.
Because the diagnosis was so quick, it may feel like you simply fixed the problem as soon as you saw it. But you still undertook a diagnostic process. You saw the alert and developed a hypothesis (“My code change caused these errors”), and that hypothesis turned out to be right. Had you truly done no diagnosis, then you wouldn’t have known what to do. The incident actually looked like this:
Contrast this with another scenario. You get alerted about slow page-loads. Together with a team, you begin to investigate the slowness. But no explanation is forthcoming. It takes an hour of searching logs, reading documentation, and consulting with other teams before you have a satisfactory explanation: an mission-critical cache object has gotten too large to store in the cache, so it has to be fetched from origin on every request. Upon reaching this diagnosis, you immediately know what to do to fix the problem:
During this long diagnostic phase, nobody would have said, “Fix the problem first. Worry about ‘why’ later.” The diagnostic effort was clearly pursued in service of fixing the issue. Whether it takes a split-second or a week, a diagnosis (at least a differential diagnosis) always has to be reached before the problem can be fixed.
These are simple examples. In a more general case, you do some diagnosis, which produces a potential fix. That fix doesn’t work (or only partly works), so diagnosis continues until another potential fix presents itself. And since multiple responders are present on the call, diagnosis doesn’t generally have to totally halt in order for fixes to be pursued:
The “Fix first” shibboleth comes out when someone perceives that there is already a potential fix, but nobody is applying that fix yet. So when you hear it, or you’re tempted to speak it yourself, first ask yourself:
Is there a potential fix on the table?
Is that potential fix worth pursuing immediately?
If the answer to both of these questions is “yes,” then by all means, get on the fix. But don’t halt diagnosis to do so, unless you’re so labor-constrained that you must.
If either question elicits a “no,” then you should talk through your reasoning with the group and make the case for pursuing further diagnosis before taking action.
I’m so grateful to Incident.io for the opportunity to shout from their rooftop about Clinical troubleshooting, which I firmly believe is the way we should all be diagnosing system failures. Enjoy the full episode!
About a year into COVID, when we were all at least 40% insane – and I had recently become a dad, so I was at like 65/70% – I became unaccountably obsessed with a pointless and, for almost all of history, unanswerable question:
What’s the farthest any person has been from the nearest other person?
Having not much better to do while my infant napped, I embarked on a long, spreadsheet-fueled journey of the mind to try to answer this question. I wanted to answer it not just for the present day (which, as we’ll see, is relatively easy), but for every point in human history.
Some of what follows is grim, I have to warn you. For most of human existence, if you were significantly far from all other people, you were probably about to die. But nevertheless, you’d have a chance of breaking humanity’s Loneliness Record before your impending death!
Early humanity
Back when there were only 2 humans in the world, every time they got farther from each other, both of them would simultaneously break the Loneliness Record.
However, unless you’re a Biblical literalist, it’s hard to imagine that there was ever a time when only 2 humans existed. Surely Homo sapiens emerged over the course of generations, each composed of beings that, in different ways, more or less resembled modern humans. So it makes more sense to start with the first migrations out of Africa, between 70,000 and 100,000 years ago. That’s when the distances start to get interesting.
Prehistory
As our ancestors migrated out of central Africa, they pushed into wilderness that was uninhabited by other humans. So we might think that they would have had plentiful opportunities to break the Loneliness Record.
However, we tend to travel in groups, especially when we’re going far. And you can’t break the Loneliness Record if you’re traveling in a group. Unless things go terribly wrong.
For my money, the most likely way for the Loneliness Record to have been broken during this period would be:
A group of travelers sets out.
They happen to go in a direction away from the rest of humanity.
They travel far – farther than anyone would be able to travel alone.
But then – uh oh! There’s a rockslide or something, and they all die.
In this scenario, the last of the travelers to die breaks our Record. Hooray!
Another way it could have happened is if someone got swept out to sea on a log. Since sailing ships hadn’t been invented yet, there’d be no other humans out there.
Now, you might wonder, what about camels? Once humans domesticated the camel, couldn’t they travel much farther over land? Yes! But humans didn’t figure out how to ride camels until about 3000 BC, by which point Austronesian peoples had already, for 15,000 years, been…
Sailing
Sailing ups the ante, because nobody lives in the ocean, and you can get a lot farther sailing a boat than clinging to a log. One of the same issues still confronts us, though: long distance sailing is usually done by groups, not individuals.
It seems likely that early sailors would have broken the loneliness record from time to time. Say your ship gets caught in a storm and blown 100 km off course. Then it sinks. If you’re the last survivor, you might get the dubious honor of breaking humanity’s Loneliness Record. Certainly, you could get a lot farther from other humans by sailing than by walking on land.
Once sailing started being used for trade, though, one has to imagine that the Record stopped getting broken so much. Advancements in sailing technology would bring distance gains, but they would also bring congestion. If sailing ships are frequently crossing the sea between nations, then even if you’re lucky (?) enough to be the doomed last survivor of a remote shipwreck, there’s probably another ship just over the horizon. So no Loneliness Trophy for you.
Of course, we can’t know when the Loneliness Record was broken during this period or by whom, because there’s no documentation. So let’s talk about the first era in which I was able to find any solid documentation of a person being Record-breakingly isolated.
The age of Antarctic Exploration
For some reason, people in the early 1900s thought it would be a really fun idea to trek to the South Pole. For Robert Falcon Scott, a Royal Navy officer and one of the first to make the trip, it was… not.
Scott led the Terra Nova expedition, an attempt to reach the South Pole for the first time in human history. But on January 17, 1912, when Scott’s party got to the Pole, they were devastated to find they’d been bested by the expedition of Norwegian explorer Roald Amundsen. Amundsen had reached the South Pole just 34 days before Scott.
If the explorers thought losing the race was bad, they were in for much worse. After a series of disasters, the entire party perished. Which is a bummer. But, on the bright side, they were 160 km from the rest of humanity when they finally succumbed to the cold. This is the first occurrence I could find of a plausible Loneliness Record-setting event with a specific distance and set of names. So congratulations to the Terra Nova expedition!
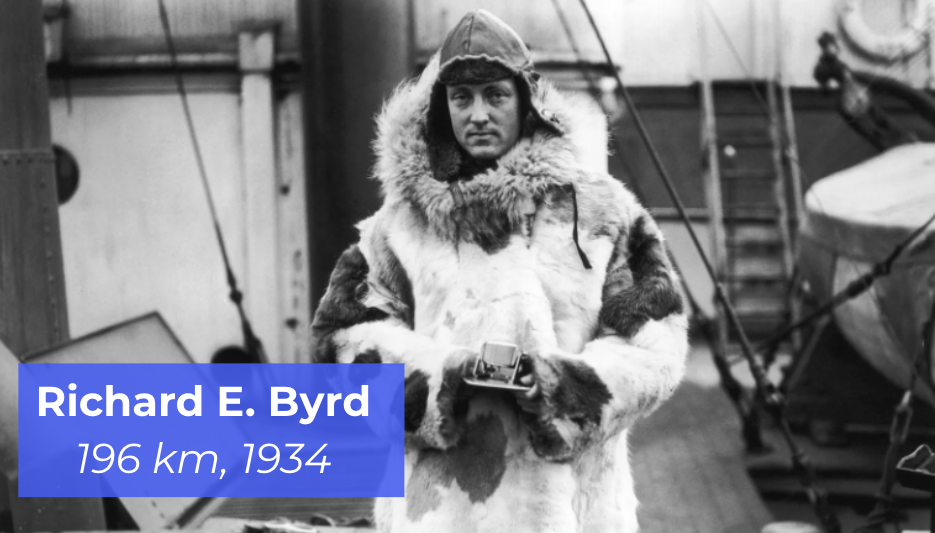
But even so, their record didn’t last long, on the historical scale. In 1934, Richard E. Byrd, an American Naval officer who had in 1926 made the first flight over the South Pole (but that’s not of interest here, since he had a co-pilot) operated a small weather station in Antarctica. The station was called Bolling Advance Base, and it was situated 196 km from the nearest inhabited location: Little America II base, on the coast.
Eventually, around August of 1934, Byrd stopped sending intelligible radio transmissions back to Little America II. A rescue party was dispatched, which found Byrd near death, suffering from frostbite and carbon monoxide poisoning. He survived to lead several more Antarctic expeditions, and for the rest of his life, he held the record (at least as far as I can tell) for Loneliest Person!
And, by the same token, Byrd had become the last person to break the Loneliness Record while staying on Earth.
The final frontier
Spacefaring really changed the scale of the Loneliness Record problem. Now our species was no longer confined to a 2-dimensional surface.
The first (human) spacefarer was Comrade Yuri Gagarin of the USSR. He took off from Baikonur Cosmodrome on April 12, 1961, and traveled in a parabolic orbit that took him 327 km above the surface of the Earth. That’s 131 km farther than Byrd’s weather station. Congratulations, Yuri Gagarin!
Gagarin got to hold this record for several years. His space mission, Vostok 1, had a higher apogee than any other of the 1-crewmember space missions (the USSR’s Vostok program and the USA’s Mercury program). And after those, we stopped sending people into space alone.
327 km is pretty far. And since the apogee of Vostok 1’s parabola was over the south Pacific, Gagarin’s distance from other humans might even have been somewhat greater. So it was eight years before the Loneliness Record was broken again. This time, though, it was utterly smashed, by an order of magnitude.
A little while after Buzz Aldrin and Neil Armstrong descended to the lunar surface on July 24, 1969, Michael Collins (who continued orbiting the moon) reached a distance of 3592 km (the Moon’s diameter and change) from his fellow travelers.
The remaining Apollo missions
Now from here, for Apollos 12–17, things are a little fuzzier. A lot depends on the exact trajectories of the capsules, and I won’t go into it here (but corner me with a pen and a cocktail napkin some time). So I might have made a mistake here, even beyond the obvious mistake of embarking on this pointless thought experiment in the first place. But, after reviewing the numbers, I think the next Record-breaking event occurred on Apollo 15:
And the last time the Loneliness Record was broken was on the Apollo 16 mission, by Command Module pilot Ken Mattingly:
My heartfelt congratulations to Ken Mattingly, the World Champion of Loneliness!
History isn’t over… yet!
One day – assuming humanity doesn’t somehow burn itself out of existence first 😉 – somebody is gonna come for what’s Ken’s.
In Kim Stanley Robinson’s Red Mars, Arkady Bogdanov and Nadia Cherneshevsky are among the First Hundred humans to live on Mars. They regularly travel the planet’s empty surface in lighter-than-air craft. Something like that could get you a Loneliness Record.
More likely, the next Record breaker will be the last survivor of some space voyage. On Mars, you can’t get meaningfully more than 6,800 km from any other point. But if you’re on the way to Mars and life support fails, then someone gets to break Mattingly’s record by probably several orders of magnitude.
It’s 12 noon on a Minneapolis Wednesday, which means Barb can be found at Quang. As the waiter sets down Barb’s usual order (#307, the Bun Chay, extra spicy), Barb’s nostrils catch the heavenly aroma of peanuts and scallions and red chiles. A wave of calm moves through her. Barb pulls her chair forward, cracks apart her wooden chopsticks, and…her pager goes off.
After cursing under her breath, she dutifully reads the message:
Error rate for `environment:production' exceeds 100 msg/s
Welp.
Barb grabs one quick bite of spring roll as she flags down the waiter for a to-go box. Opening Slack on her phone, she declares an incident, joins the Zoom call, and hurries back up Nicollet Ave. and around the corner, toward her apartment.
Five minutes later, finally sitting at her laptop, Barb is pretty sure she knows what the problem is. The error flooding the logs is:
object 'nil' has no method 'reimport!'
That looks like a straightforward app bug to her, and wouldn’t you know it? Right before these errors started cropping up, there was a deploy to the Rails app by a newish dev named Alice, who according to her Slack profile, is based in Seattle. Barb asks this ‘Alice’ to join the incident Zoom.
– Hi, this is Alice. What’d I do? – Thanks for joining, Alice. I’m incident commander for this spike of production errors. It looks like you deployed a change at 17:46 UTC and a bunch of errors started happening. Can you revert that change please? – Sure, no problem. I’ll put together the revert PR now.
5 minutes later, Alice’s PR is approved. Alice click’s “Merge.” The pair begin the anxious but familiar 15-minute wait for CI to pass, all the while greeting and informing the bewildered latecomers who straggle into the call.
Alice’s story
Alice stares blankly at the white rectangle on her monitor. She spent her first hour getting yesterday’s frontend bugfixes pushed out, and now it’s time to start her PowerPoint. She’ll be working on this PowerPoint for the rest of the morning, probably through lunch, and all afternoon.
Alice shuts her eyes and heaves a dismal sigh. Alice fucking hates PowerPoint. But she can’t put it off anymore. So she dons her headphones, cracks her knuckles,, and… gets an urgent Slack message:
Morning, Alice – we’ve got a production incident involving a spike of errors, and it looks like it coincides with a deploy of yours. Can you jump on https://zoom.globocorp.co/z/123456789… when you have a moment please?
As she waits for Zoom to load, Alice feels something almost like relief. At least she doesn’t have to work on that goddamn PowerPoint yet.
– Hi, this is Alice. What’d I do? – Thanks for joining, Alice. I’m incident commander for this spike of production errors. It looks like you deployed a change at 16:46 UTC and a bunch of errors started happening. Can you revert that change please? – Sure, no problem. I’ll put together the revert PR now.
Alice quickly whips up that PR and gets it approved. She spends the next 15 minutes waiting for CI to pass, while absent-mindedly writing the first slide of her PowerPoint. By the time the tests are green, she has typed out and deleted 4 different titles.
The real story
This incident seems to have gone about as well as it could, considering. Alice was on the call within 7 minutes of the alert, and a PR was ready 5 minutes later. It would be great if CI were faster, or even better if CI could be skipped for a revert. They’ll talk about that at the post-mortem.
However, nobody in the call yet knows what really happened. What really happened is this:
Alice’s 16:46 UTC deploy was the first to pick up the latest Docker image.
The new Docker image includes an update to a software dependency.
The updated dependency has a bug that only shows up in production.
But instead of knowing any of that, Alice and Barb are sitting here for 15 minutes waiting for CI to run, so they can deploy a fix that won’t even work.
This is a garden-path incident. Barb has what she feels is a strong signal from the telemetry, which points toward a bug in Alice’s code. Alice has what she feels is a strong signal, which is that Barb seems very confident in her conclusion. But they’ve been led up the garden path, and as a consequence, this incident will run longer than it needs to.
How this could all have been avoided
Imagine instead, that Barb and Alice are both in the habit of saying their hypotheses out loud.
When Alice joins the call, Barb instead says:
– Thanks for joining, Alice. I’m incident commander for this spike of production errors. It looks like you deployed a change at 16:46 UTC and a bunch of errors started happening. My hypothesis is that your change triggered this spike of errors. Can you revert the change please?
Instead of letting Alice infer that the cause of the error spike is already known to be her deploy, Barb acknowledges the limits of her certainty. She has a hypothesis, not a definitive diagnosis. This gives Alice the opportunity to respond with something like:
– Well, are the errors from the backend or the frontend? Because my change was frontend-only.
And just like that, Alice and Barb have stepped back from the garden path. Instead of waiting around for a useless CI cycle, they can continue straight away with diagnosis.
Note that, even if Barb doesn’t state her hypothesis, things will still be okay as long as Alice does:
– Hi, this is Alice. What’d I do? – Thanks for joining, Alice. I’m incident commander for this spike of production errors. It looks like you deployed a change at 16:46 UTC and a bunch of errors started happening. Can you revert that change please? – Sure, no problem. I’ll put together the revert PR now. Just to be clear, the hypothesis is that my frontend-only changeset is somehow causing these nil-has-no-method errors in the backend? – Uh, did you say frontend-only?
Again, Barb and Alice have gotten themselves off the garden path. Which means this technique – stating your hypothesis and asking for rule-outs – is something you can do unilaterally starting today to make your team better at troubleshooting.
Another thing you can do to make your team better at troubleshooting is employ Clinical Troubleshooting against your next head-scratcher of a bug.
When your site goes down, it’s all hands on deck. A cross-functional team must assemble fast and pursue an organized response. It feels like fighting a fire. So it’s not surprising that formal IT incident management tends to borrow heavily from the discipline of firefighting.
However, in software incident response, we have a crucial constraint that you won’t find in firefighting. Namely, in order to fix a software product, we first have to understand why it’s broken.
When the firefighters arrive at the blazing building, they don’t need to explain the fire. They need to put it out. It doesn’t matter whether a toaster malfunctioned, or a cat knocked over a candle, or a smoker fell asleep watching The Voice. The immediate job is the same: get people to safety and put out the fire.
But when PagerDuty blows up and we all stumble into the incident call, we need atleast a vague hypothesis. Without one, we can’t even start fixing the problem. What should we do? Reboot one of the web servers? Which one? Should we revert the last deploy? Should we scale up the database? Flush the CDN? Open a support ticket with Azure? Just wait?
We can’t act until we have at least some explanation for how the outage came about.
Often, the process of diagnosis – of explaining the failure – takes up the majority of the incident. Diagnosis isn’t easy, especially in a group and under pressure. Important facts go ignored. Hypotheses get forgotten, or remain unchallenged in the face of new information. Action items fall through the cracks. Diagnostic disconnects like these add up to longer outages, noisier public-facing comms, and repeat failures.
And yet, when we look to improve IT incident response, what do we usually focus on? On-call rotations, status page updates, command-and-control structure. Sliding-down-the-firepole, radioing-with-dispatch type stuff.
In software incident response, we need to maintain a coherent diagnostic strategy in the face of scarce information and severe time pressure. This makes us, on one dimension at least, more like doctors than firefighters. This is one of the reasons that engineering teams find immense value in clinical troubleshooting. It brings rigor and transparency to the joint diagnostic effort.
Thanks very much to host Stephen Townshend of Slight Reliability podcast. We talked about incident response, diagnosis, and looking for trouble. It was very chill!
When you deploy broken code, it may cause an incident. Then you’ll have to declare an incident. And don’t forget to create an incident so customers can stay informed!
“Incident” can mean a bunch of things, and these meanings are only partly distinguishable through context. When the word “incident” is used ambiguously, confusion can emerge.
The effort to fix the problem
In many organizations, the organizational formalism around responding to a problem is called an “incident.” For example,
At 08:40 UTC, engineer Geordi La Forge declared an incident after observing high API latencies in production. The incident was led by Beverly Crusher, and it was resolved after 32 minutes.
We’ll call this usage an incident-effort. An incident-effort need not correspond to an outage. You can create one for any problem on which you want multiple sets of eyes. For example, if deployment to the staging environment is borked, or if disk utilization is growing too rapidly on a database server, you might declare an incident(-effort).
The public thread of communication
When stakeholders need to be informed of a problem – often, these stakeholders are customers – we’re expected to “create an incident.” This kind of “incident” (let’s call it an incident-post) is usually a post on a publicly-facing website, describing the problem and the current state of the response to it.
An incident-effort may exist without an incident-post. An incident-post may also exist without an incident-effort (for example, if an incident is used to communicate about a planned maintenance window).
Finally, there is the problem itself: that which is to be fixed, or communicated about.
There are many problems that don’t merit an incident-effort, let alone an incident-post. We usually just call such problems “bugs” or “risks.”
When someone says “We’ve had too many incidents this quarter,” they’re probably talking about problems that caused downtime. But they might be talking about incident-posts themselves, depending on how they’re looking at things. It pays to clarify.
Never being one to shy away from an opportunity to make a Venn Diagram, I’ll leave you with a few common phrases around incident management:
I offer incident response training or remote or on-site. Get in touch.
When troubleshooting a high-impact software failure in a group, you have to be ready for shifts in tenor. One moment there’s a frenzy of coordination, and the next: absolute silence.
Silence is natural and often useful. But to be an effective incident commander – whose job is to keep the problem-solving effort moving forward – you must develop a keen ear for silence.
Silence can mean different things to different people in different situations. In this post, I’ll present a few incident scenarios and explore the role of the incident commander in breaking (or simply abiding in) dead air.
“Any minute now”
Sylvain (from the [s]upport team) has spun up an incident call after getting 3 consecutive reports of broken CSS on the production app. You are the incident commander, and Oscar (from [o]perations) has immediately volunteered to be the primary investigator. Deanna and Deepak (software [d]evs) are also on the call.
There’s some ambiguity about whether the CSS issue merits a status page post. Nobody has found a “smoking gun” showing that, for example, 404 errors are happening at an elevated rate. And now Oscar announces, “I’m seeing some log entries from the web server that look a little weird. I’m gonna look at those.” This is the beginning of a 5-minute silence.
During the silence, Deanna, Deepak, and Sylvain are all waiting, hoping that these log entries that Oscar just noticed turn out to be the smoking gun. They’re putting their eggs in the basket of Oscar’s intuition. Hopefully he’s seen this issue before, and any minute now he’ll say “Okay, I’m pushing a fix.”
The problem is, it’s equally possible that Oscar has latched onto a red herring (some salient but ultimately irrelevant observation). If there were a conversation in place of silence, then Deanna could be researching the error message, or Deepak might be able to immediately rule out the error as a cause of the broken CSS, or Sylvain could provide a detail from one of the customer tickets that would narrow the scope of the investigation. But instead, everybody’s twiddling their thumbs hoping for Oscar to emerge with a fix.
An incident commander is responsible for keeping the whole problem-solving effort moving forward. So it’s incumbent on you to interrupt this silence.
Try drawing more information out of Oscar:
“Oscar, do you mind sharing your screen so Deepak and Deanna can see the weird log messages too?”
“What’s the error message, Oscar? Can you send a link to a log search?”
“Do we know when these log events started? Does that line up with when we started receiving these support tickets, Sylvain?”
The more we audit each other’s thought processes, the more effective we are at joint problem-solving. An IC must make this happen.
“LGTM”
Sylvain has spun up an incident call after getting 3 consecutive reports of broken CSS on the production website. You are the incident commander.
Oscar has checked a bunch of graph dashboards and hasn’t found any evidence of a widespread system failure. He’s said as much. Now there’s relative silence on the call for five minutes.
Deanna and Deepak are basically in agreement with Oscar: there’s no evidence of a system health issue. To them, and to Oscar, it’s not really clear how strong a signal Sylvain has. It could just be a coincidence that these three reports all arrived in a row. The engineers on the call are thinking, I guess we’ll keep poking at this, but we’re not even sure this is a real issue. We need more information.
Sylvain, on the other hand, is positive that something is wrong. Getting 3 support tickets in a row about the same behavior is very strong evidence to him. He’s presented his information to the investigators, and now he’s thinking, Okay, they say it’s not a widespread issue. But I’m sure Oscar is getting to the bottom of it.
There’s been a common ground breakdown, and as a result, a silence that becomes more and more frustrating.
As incident commander, you should focus the group’s attention on observable symptoms by asking questions like:
“Has anybody been able to reproduce these broken page-loads in a browser? Preferably with Dev Tools turned on?”
“Sylvain, I don’t have an intuition for support ticket frequencies. How unusual is it to get 3 reports of the same thing right in a row like this?”
“Can we find, in the access logs, just one example of a stylesheet request that returned a non-200 response?”
“Let’s see here…”
Sylvain has spun up an incident call after getting 3 consecutive reports of broken CSS on the production website. You are the incident commander. The investigation has been going along, and Oscar is chasing down a hunch that a particular error message from the web server is related to the stylesheet failures. Deanna is digging into some code to help validate Oscar’s hunch.
Deepak joins the call. There’s no chatter, as everyone is waiting for Oscar and Deanna to come up with their findings. So Deepak reads the chat scrollback, which takes him about 5 minutes. It’s not until the end of those 5 minutes that Deepak understands what Oscar and Deanna are working on.
As it happens, Deepak has seen the web server error message in question before. He knows what it means, and he can explain why it’s a red herring. But for the 5 minutes it takes him to get up to speed by reading the chat scrollback, silence persists.
In order to keep a problem-solving effort moving forward, an incident commander should ensure that every new participant gets up-to-date knowledge of what the group is doing and why. At small scale (less than, say, 10 people on the call), you can do this verbally. For example, you could say to Deepak when he joins the call, “Hi Deepak. Right now, Oscar and Deanna are investigating a web server error message that might be related to failed stylesheet loads. You can see the error message in the chat.”
When there are more than 10 people, the verbal approach stops working. It becomes necessary to have a shared document of some sort, continuously updated by a “scribe.” It’s not sufficient for this document to be merely a timeline of events: it must highlight the current state of the joint diagnostic effort. I recommend clinical troubleshooting for this.
“I need 5 minutes”
When incident response is going right, everybody understands what’s being done by whom, and why. As information comes to light and our strategies evolve, it takes more or less constant communication to maintain this state. That’s why silence on an incident call is so often an indicator of trouble: when there’s silence, communication isn’t happening.
There is, however, a healthy kind of dead air.
Sometimes an investigator needs to go silent for a while to chase down a hunch, or collect some data, or research some question. As long as such a silence is negotiated in advance, with a specific time to reconvene, it can serve a crucial purpose. I call this functional dead air.
It’s the job of the incident commander to ensure that every nontrivial silence is functional. First, communicate what’s being done by whom, and why. Only then, do it.
I offer incident response training for engineers. Get in touch!
Over my career as an SRE, I’ve diagnosed thousands of production issues. When I’m lucky, I have enough information at hand, and enough expertise in the systems involved, to get to the bottom of the problem on my own. But very often I need to bring together a team.
Troubleshooting with a team unleashes enormous power. Problems that would have taken me days to solve as an individual might take only hours or minutes, thanks to the benefit of pooled knowledge.
However, collaborative troubleshooting also comes with dangers. Time and again, I’ve seen groups struggle to make progress on an investigation due to miscommunication, misalignment, and confusion. Among other difficulties, the fundamental common ground breakdown can have especially heinous consequences in this context.
Over the years, I’ve developed a reliable method for harnessing the diagnostic power of groups. My approach is derived from a different field in which groups of experts with various levels of context need to reason together about problems in a complex, dynamic system: medicine.
I call this method clinical troubleshooting.
The clinical troubleshooting process
Although clinical troubleshooting can be useful in solo troubleshooting, it really shines as a group activity. It’s a lightweight structure that always adds value. I recommend reaching for clinical troubleshooting as soon as you need to involve another person in any “why” question about an unexpected behavior of your system.
Step 0: Get a group together
Before you start, gather the people you’ll be troubleshooting with. Any synchronous communication channel can work for this: Slack, Zoom, a meeting room; you name it.
You don’t need a big group. In fact, a small group is best. What matters most is that you bring together diverse perspectives. If you’re a backend engineer, try to pull in a network engineer and a frontend engineer, or a support agent and a sysadmin. Cast a wide net.
Once you have an initial group, share a blank Google doc with everyone.
Step 1: Identify symptoms
Add a Symptoms header to the doc.
You’re the one bringing the issue, so you must have some observations already. Write those down in a numbered list.
It’s important that it be a numbered list rather than a bulleted list. As the troubleshooting process goes on, you’re going to want to refer to individual symptoms (and, later, hypotheses and actions). If each symptom has a number and the number never changes, this is a lot easier.
Ask your collaborators to list symptoms, too. They may have observed some other facet of the problem, or they may think to look at a graph that you don’t know about.
Here’s what an initial symptom list might look like:
Symptoms
About 5 times a day, the Storage API sends a spike of 503 responses. Each spike lasts about 500 milliseconds and includes between 200 and 1000 responses (about 0.1 to 0.5% of all responses sent during the interval)
Outside of these spikes, the Storage API has not sent any 503 responses at all in the last 14 days.
The failing requests have short durations, around the same as those of normal requests (mostly under 100 milliseconds).
(In this and subsequent examples, don’t worry about understanding the exact technical situation. Clinical troubleshooting can be used on problems in any part of any tech stack.)
All the symptoms on the list should be precise and objective. In other words, if a statement is quantifiable, quantify it. Don’t make suppositions yet about why these phenomena have been observed. That comes next.
Once you’re all on the same page about what problem you’re investigating, the initial symptom list is done.
Step 2: Brainstorm hypotheses
Add a Hypotheses header to the doc. Invite your colleagues to join you in suggesting hypotheses that might explain the symptoms.
Let the ideas flow, and write them all down. This is where having a diverse set of perspectives in the room really pays off. Your co-investigators will think of hypotheses that would never have occurred to you, and vice versa. The more of these you come up with, the more likely the actual explanation will be on the list.
A hypothesis can’t be just anything, though. A hypothesis must
explain (at least some of) the symptoms,
accord with all known facts, and
be falsifiable (that is: if it were false, we’d be able somehow to prove it false).
For example, given the symptoms above, “requests to the storage API are getting queued up behind a long-running query” would not be a sound hypothesis, since it’s inconsistent with Symptom 3. If requests were queued up, we’d expect them to take longer before failing.
After some discussion, your hypothesis list might look like this:
Hypotheses
A particular request causes an out-of-memory (OOM) event on a storage server, and all in-flight requests to that server get killed.
A network hiccup causes connections between the load balancer and a storage server to be severed.
Requests to the storage API are getting queued up behind a long-running query
Discarded because inconsistent with Symptom 3
A network hiccup causes connections between storage API servers and a persistence layer node to be severed.
Again, use a numbered list. If a hypothesis is ruled out or deemed irrelevant, don’t delete it: you don’t want the list numbering to change. Instead, mark it in some with formatting. I use strikethrough. Gray works too.
Step 3: Select actions
Add an Actions header.
In a new numbered list, choose one or two actions that will advance the troubleshooting effort. Usually, you should pick actions that will rule out, or “falsify,” one or more of the hypotheses on the table.
To rule out Hypothesis 2 above, for instance, you could review the logs for one of the error spikes and check whether all the affected requests were associated with the same load balancer or the same storage server. If the requests are distributed across your infrastructure, then Hypothesis 2 is ruled out (and Hypothesis 1 as well, for that matter!).
When you agree upon actions, it’s best to assign them to individuals. Sometimes an action can be taken right away, and other times it’ll take a while and the group will have to reconvene later. But ownership should never be unclear.
Ruling out hypotheses the only purpose of actions in clinical troubleshooting. You can also assign actions that expand the group’s understanding of the problem, in order to generate new symptoms and new hypotheses. These actions can be things like, “Read the documentation on system X‘s network configuration,” or “Search for blog posts about error message E.” As long as there’s at least one hypothesis in the running, though, there ought to be at least one action in flight that could falsify it. That’s one of the ways clinical troubleshooting ensures constant progress.
Steps 4 through N: Cycle back through
When actions are completed, you get more information for the symptom list. More symptoms suggest new hypotheses. New hypotheses imply further actions. Just keep going through the cycle until you’re satisfied.
Sometimes you won’t be satisfied until you have a definitive diagnosis: a solid explanation for all the symptoms that’s been proven right. Other times, you’ll be satisfied as soon as you take an action that makes the problem go away, even if there’s still uncertainty about what exactly was going on.
In any case, clinical troubleshooting will reliably get you to the solution.
Keep things moving forward
In the absence of structure, collaborative diagnosis can stall out. Or worse, go backward.
With clinical troubleshooting, there’s always a next step forward. Teams that practice this method will consistently get to the bottom of technical mysteries, even when strapped for data or under intense pressure. And over time, as this scientific way of thinking becomes a habit, and then a culture, we come to understand the behavior of our system that much better.
I can teach your team how to do this. Get in touch.
In SaaS, when we’re hiring engineers, we usually imagine that their time will mostly be spent building things. So we never forget to interview for skills at building stuff. Sometimes we ask candidates to write code on the fly. Other times we ask them to whiteboard out a sensible architecture for a new software product. We ask them to tell us a story about a piece of software or infrastructure that they built. All this focus on building things ensures that we’ll end up hiring a candidate who can build things.
And yet, when you work in SRE or operations, or really any backend engineering role with an on-call rotation, troubleshooting is one of your core responsibilities. Some months, you’ll spend far more time troubleshooting than building. So shouldn’t your troubleshooting skills be evaluated during the interview process?
When I talk about interviewing candidates for troubleshooting skills, I mean answering questions like:
Can they distinguish relevant from irrelevant facts?
Do they seek to answer specific questions?
Will they keep an open mind about the cause of a problem, rather than jumping to a conclusion?
Are they able to express their thought process to a colleague?
When they hit a dead end, will they get discouraged? Or will they calmly seek out a different approach?
Do they have a strategy?
Several times throughout my SRE career, I’ve put together interview processes to screen for these skills. The most effective method I’ve found is to create a sort of interactive role-playing game in which the candidate tries to solve a tricky bug in a complex system.
In this post, I’ll show how I went about creating one of these interview questions and how I evaluated the performance of candidates. I hope you’ll be able to copy my approach and produce your own such interview scenario (please reach out if you try this!). If you do, you’ll raise the bar for diagnostic skills on your team, and your operations will run that much more smoothly.
The incident
Around a year into my stint at $lastJob, I was tapped to organize an ongoing investigation into weird, customer-facing, nondeterministic-seeming API timeouts.
The API in question was essentially a private software package registry. But the authentication logic that made the registry private was not implemented in the registry itself. Instead, calls to this registry were proxied by a broader, public-facing API, which handled auth/auth considerations. Here’s a diagram of the whole situation:
Timeouts would occur seemingly at random, at a rate of about 1 timeout per 10,000 requests. The content of the request didn’t matter: any given request for the private registry might hang for 10 seconds and then fail. But if you immediately retried the same request, it would succeed.
I led a team of 4 engineers in a diagnostic effort, and after almost 3 weeks of methodical investigation, we finally got to the bottom of these timeouts. Along the way, we stumbled into several dead-ends and chased a fair number of red herrings.
I’ll spare you most of the details, but it’s important to note the existence of all these dead-ends. They later served as a signal that this problem was sufficiently complex and counterintuitive to give interview candidates a real workout. When you go searching for an incident to turn into a troubleshooting skills interview, look for investigations with lots of dead-ends.
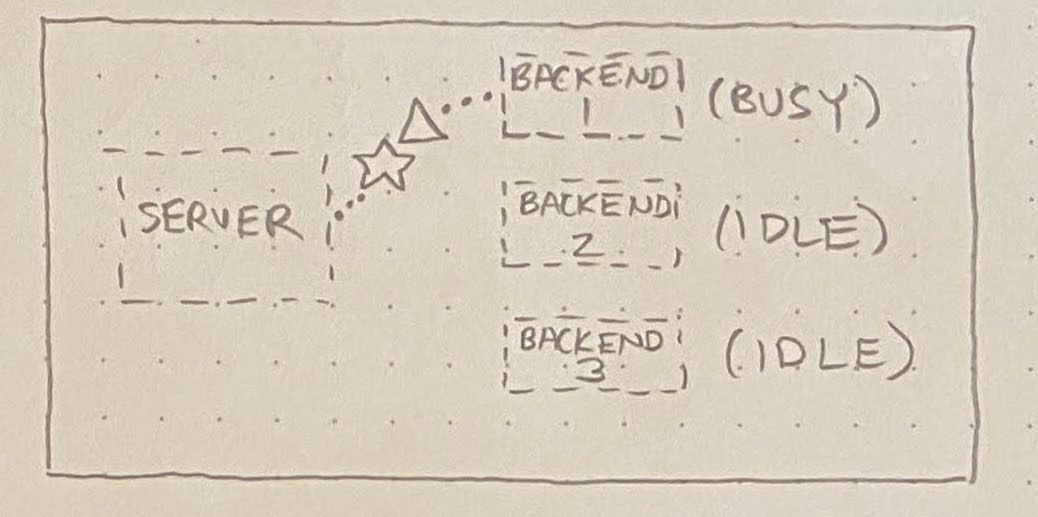
Anyway, the root cause (come at me) ended up being as follows. When requests arrive at the private registry, they’re served by one of N identical “backend” processes (in the diagrams below, N=3). A server distributes requests to these backends, always picking an idle backend if one exists:
If no backend is idle, then the server must queue up the incoming request behind an in-flight request:
What we found is that, occasionally, a particular script would execute an extremely long-running request against the registry API. This would normally be okay, but once in a blue moon, a few of these long-running requests would happen to hit the same server. This tied up multiple backends, resulting in one or more requests (☆) getting queued behind these pathologically long-running requests (△):
Altogether, this made for a very confusing set of observations:
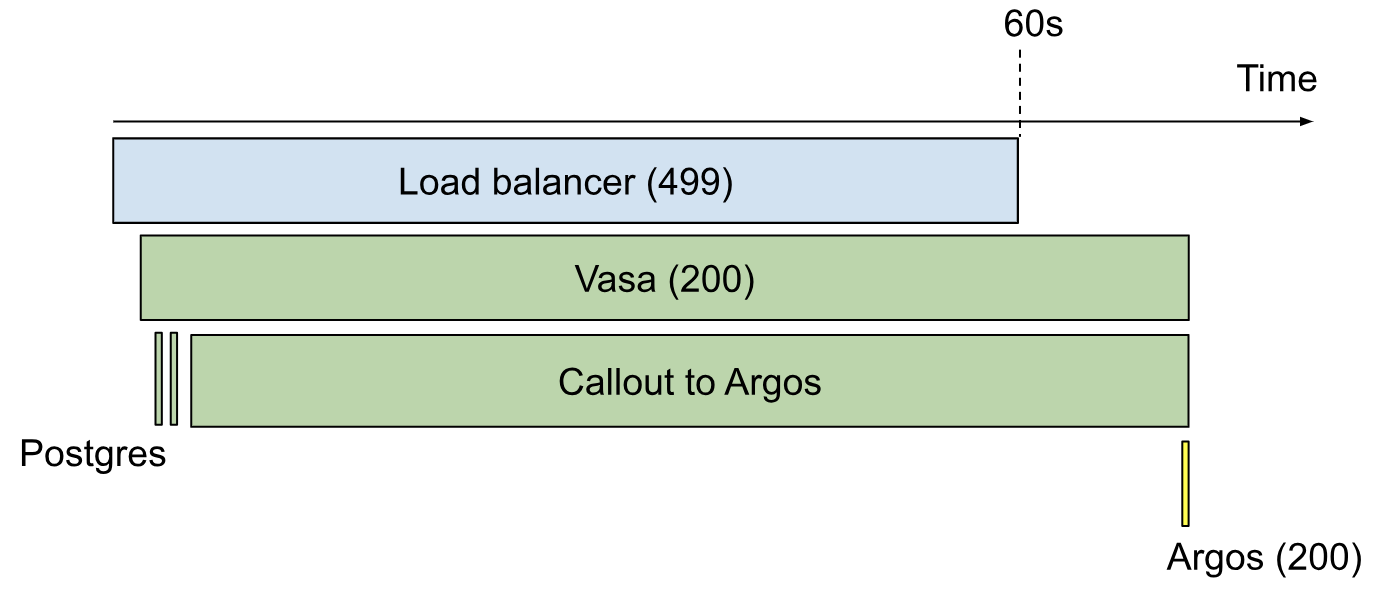
Requests passing through the fronting API would occasionally take extra long, regardless of their content.
If one of these requests took longer than 10 seconds, a timeout would be reached in the CLI, resulting in a customer-facing error message. In this situation,
The request would continue running in the fronting API, and would be logged by that system as a high-latency 200.
This same request would be logged as a low-latency 200 at the registry level, since that subsystem would not start its stopwatch until the backend started processing the request.
At the load balancer, this request would be logged as a 499, which means “the client closed its connection before we could send a response.”
If one of these requests took longer than 60 seconds, though, a load balancer timeout would be reached.
The fronting API would log a 499
The load balancer would log a 502 Bad Gateway
The registry would never log this request at all.
The confusing nature of these symptoms is what made this issue such a perfect model for our troubleshooting interview.
How I turned this into an interview question
A while after this confusing incident was resolved, I was faced with the prospect of hiring SREs for my team. Since I’m very much a “squeeze the problems out of the system you have” person, rather than a “build new stuff with less problems” person, I wanted to make sure our interview process screened for good diagnostic skills.
So I reviewed the registry timeouts incident. How could I turn that messy, roundabout, real-world investigation into an approachable interview question that would help me gauge a candidate’s troubleshooting skills?
I changed some names, removed a couple complicating factors that would just muddy the waters, and wrote up a training document for interviewers. The training document included:
A description of the hypothetical architecture in which the exercise would take place;
A detailed explanation of the issue to be investigated, including discussion of the implications this issue would carry for observable artifacts (e.g. metrics, logs, traces, error messages);
A guide to conducting the interview (what to say, what not to say, how to evaluate responses).
The document’s description of our hypothetical architecture included a bird’s-eye-view diagram of our made-up architecture:
A service called “Vasa” took the place of the fronting API described earlier. Postgres was included in the diagram despite its irrelevance, introducing a bit of misdirection.
To stand in for the private registry where all the queueing nonsense happened, I made up a microservice called “Argos.” It’s not shown in the bird’s-eye-view diagram. Instead, once the candidate localized the problem to the Argos service, I’d show them another, more zoomed-in diagram that included details of the Argos architecture.
One key modification was that I made Argos (the private registry stand-in) into a generic “workspace metadata storage service.” I didn’t want candidates to fixate on the software-registry aspect of the problem, since that wasn’t especially relevant. People understand metadata storage and retrieval, and it’s boring, so they don’t ask many questions about it.
Conducting the interview
The actual interview takes the form of a role-playing game, almost D&D-esque. I start with a brief spiel:
This is going to be a sort of troubleshooting roleplay adventure, in which you play as an SRE investigating a system problem. I'll lay out the system and the problem under investigation, and you'll get to ask questions and take actions as you see fit. As you learn new things, we can take notes in the Google Doc which I'm sharing now. Sound good? Shall we get started?
After a bit of experience, I added another section to the intro:
The exercise we're going to do is based on a real-world bug that took a team of 4 people several weeks to figure out. I mention this because I don't want you to get to the end of the interview and think, "Oh no! I didn't solve the problem! I must have failed the interview." It's very common for candidates to run out of time without finding the answer but still do very well. I'm much more interested in how you go about investigating the problem than in how far you get.
With that, I show them the architecture diagram (above) and give a bird’s-eye-view description of the system they now “own.” Then we get into the problem:
One day, you get assigned a ticket. According to the ticket, the support team has been getting an increasing number of reports of an issue in which a customer runs a "Get Workspace" command in the CLI, and the CLI hangs for 10 seconds before printing this message and crashing:
ERROR: timeout waiting for response from server
Several users have additionally reported that, if they immediately re-run their "Get Workspace" command, it succeeds as normal in under 200 milliseconds.
“Alright,” I say to the candidate, “so you’re assigned this ticket. What do you do first?”
From here, different candidates go in all sorts of different directions. Some want to ask more questions of the support team. Some want further clarity on the architecture. Some immediately dive into logs and metrics. I don’t try to guide them. I just make up plausible answers to their questions, given my knowledge of the underlying problem. For example:
CANDIDATE: Can I ask the support team if there was anything else in common between the customer reports that they received?
ME: Sure. Support doesn't understand quite what you're asking, but they give you links to all the relevant tickets. What do you look for?
CANDIDATE: Are all the tickets from the same part of the world, or all from the same time of day or something?
ME: You don't see any common geographic characteristics. Some of the customers are from North America, some are from Asia, some are from Australia. It does seem, from your limited sample, that most of the reports are from North American business hours, roughly mid-day, on weekdays.
Even this early in the interview, I can sometimes detect warning signs. If a candidate immediately jumps to a specific hypothesis and gets stuck on it, I’m pretty sure this interview isn’t going to go well. But I’ll let them keep going:
CANDIDATE: This sounds like a caching issue, because the requests are failing once and then succeeding on the second try. Are there any caches in the system that might be timing out?
ME: There are many caching layers. There are filesystem caches, of course, and there's the buffer cache in the database. Some data items are cached in Memcache, as you can see in the diagram, and then some of the microservices have caching layers of their own.
CANDIDATE: Okay, then I guess I'd look at the health of those caching layers.
ME: Alright. How would you look at their health? What kinds of things would you look for?
CANDIDATE: Like error messages, high CPU usage, that sort of thing.
This candidate is not likely to do well. Instead of asking targeted questions to hone in on the location of the problem, they’ve leapt to a specific kind of problem (probably one they’ve seen recently in their job) based on very little evidence. Moreover, they’re not looking for the right kind of evidence. They’re looking for evidence that would confirm their suspicion, but when they don’t find any, their suspicion still won’t be ruled out. They could spin their wheels like this for the whole hour. But if that’s what they want to do, I’ll let them.
Since the problem under investigation is sporadic (about 1 in every 10,000 requests), any approach that involves looking at aggregate system-health stats will reach a dead-end pretty quickly. Even good candidates may initially set out in the system-health direction, but they’ll quickly recognize the dead-end and incorporate this new information into their reasoning. They’ll adapt and find a new strategy.
One such strategy is to try to find evidence of the failed requests in the system logs. But I make them work for it:
CANDIDATE: I look in the logs to try to find the requests that are timing out.
ME: Okay. Which logs do you look in? We've got logs from the load balancer, logs from the Vasa service, logs from the DB…
CANDIDATE: The ones for the Vasa service.
ME: The Vasa service has both access logs and error logs. Which one do you want to search?
CANDIDATE: Let's look at the access logs for now.
ME: Cool. How do you find the entries you're interested in?
CANDIDATE: Oh. Hmm. Do we have the client IP addresses for any of the timeouts?
ME: You search through the support tickets, but you don't find any client IP addresses.
CANDIDATE: I guess then I would try to find requests for the Get Workspace endpoint that lasted longer than 9.99 seconds.
When a candidate gives me enough information for a log search, I’ll make up some results, being sure to also document the parameters that were included in the search. For example,
Searching in the Vasa access logs for Get Workspace requests that lasted longer than 9.99 seconds in the last 24 hours, you find:
– 1000 total
– 900: response code 200
– 100: response code 503
This is progress, but candidates often get stuck here for a couple reasons. Some get hung up on the request latencies. They’ll look for requests with latencies of exactly 10 seconds (of which there are none), or they’ll look for requests with latencies around 10 seconds (of which there are a few, most of which are unrelated to the problem at hand.) In the real-world investigation, we found that the borked requests as logged by Vasa had latencies ranging all the way up to 60 seconds, but because the request timeout built into the CLI was 10 seconds, the client would only hang for 10 seconds.
Other candidates would get hung up on the response codes. Since customers are experiencing errors, the investigator would assume that the 503 responses in the log search results above are the ones causing the problem. But in reality, it’s the 200s. Due to mismatched timeouts, the stuck requests can linger in Vasa and Argos until well after the client has gone away, ultimately succeeding but without any client to return their 200 result to.
Once a candidate finds a specific request that they suspect represents an instance of the problem, they usually want to look at a trace. In this situation, I simply draw one by hand using the Insert => Drawing command in the Google Doc. Here’s such a drawing:
And so the process goes back and forth like this until time runs out. In all the dozens of times I administered this interview, no one ever made it to the end. But, just like I told candidates at the beginning, that’s not what I cared about anyway.
At the end, I ask the candidate to do one last thing:
Alright, you've gotten pretty far, but now let's suppose it's time for you to go home. Maybe you're even going on vacation. How will you update the ticket?
With this prompt, I’m hoping the candidate will describe:
the relevant new facts they’ve observed,
the explanations they’ve ruled out, and
what they recommend doing next.
A candidate who simply lists all the actions they’ve taken and the results of those actions is missing the point. I want to see that they can synthesize their observations into a coherent and succinct form that a colleague with comparable skills will be able to easily pick up where they left off.
Evaluating results
The evaluation of candidates’ performance on this interview goes directly back to the troubleshooting skills that I enumerated at the beginning:
Can they distinguish relevant from irrelevant facts?
If they spent long periods going down rabbit holes that had nothing to do with the timeouts under investigation, then the answer is “no.”
Do they seek to answer specific questions?
When candidates are strong in this area, they’ll reason out loud about their hypotheses. I’ll know why they’re asking for a specific piece of information because they’ll tell me why.
It’s also pretty easy to tell when a candidate is just throwing stuff at the wall to see if anything sticks, and that’s big points off. This is not how you troubleshoot effectively.
Will they keep an open mind about the cause of a problem, rather than jumping to a conclusion?
Often, candidates will fixate on a particular area of the stack. “This really feels like a database problem…” or the like is a common thing to hear. Of course it’s okay – and often good – to have a hunch. But the difference between ineffective and effective troubleshooters is that the ineffective ones will keep trying to prove their hunch right, whereas the effective ones will try to prove it wrong.
Are they able to express their thought process to a colleague?
The “update the ticket” question at the end is very helpful here, but I can usually get solid evidence on this well before then. Throughout the exercise, a good troubleshooter will recognize shifts in their thinking and note them aloud. A not-so-good troubleshooter will leave me in the dark.
When they hit a dead end, will they get discouraged? Or will they calmly seek out a different approach?
On many occasions, I’ve seen candidates get discouraged at a perceived lack of progress. Usually I try to help them find a different direction to go in, and then they’re able to pick their momentum back up. But some people just shut down and stop playing the game. Others go all the way back to the beginning and start casting about for hints in seemingly random parts of the stack. These are signs that the candidate lacks the doggedness required to consistently troubleshoot difficult problems.
Do they have a strategy?
This is what it’s all about. I’m looking to hire someone who makes efficient use of all the resources and information available. Someone who doesn’t just seek out information, but seeks out the particular information that will narrow the search space. It’s only these strategic thinkers who pass this interview, and having subsequently worked with several of them, I can confidently say that this interview technique gets great results.