I recently had the pleasure of reading anthropologist David Graeber’s 2018 book, Bullshit Jobs: A Theory. Graeber defines a bullshit job as,
a form of paid employment that is so completely pointless, unnecessary, or pernicious that even the employee cannot justify its existence even though, as part of the conditions of employment, the employee feels obliged to pretend that this is not the case.
Bullshit Jobs is dotted with harrowing testimonials from all over the corporate sphere. It opens on Kurt, who is employed by a subcontractor of a subcontractor of a subcontractor for the German military. Whenever a soldier needs to move offices, Kurt’s job is to “take [a] rental car, drive [100-500 km] to the barracks, let dispatch know that [he] arrived, fill out a form, unhook the computer, load the computer into a box, seal the box, have a guy from the logistics firm carry the box to the next room, … [unseal] the box, fill out another form, hook up the computer, call dispatch to tell them how long [he] took, get a couple of signatures, take [the] rental car back home, send dispatch a letter with all of the paperwork and then get paid.”
Then there’s Gerte, a receptionist for a publishing company, whose main responsibilities are answering the phone the 1 time a day it rang, keeping the candy dish full of mints, and winding the grandfather clock in the conference room once a week. There’s Tom, who earns £100,000 a year using postproduction trickery to whiten the teeth and highlight the hair of models in television advertisements. From homeowners association managers to call center agents to full-time photocopiers of records in the VA, the subjects of this book all report the same grave and inescapable feeling that their work is completely pointless.
Graeber sees the proliferation of bullshit jobs as a moral tragedy. Why do we insist on employing people to do unnecessary work? Work for work’s sake is wanton domination.
I found it easy to identify with many of the people interviewed in Bullshit Jobs. I’ve certainly had jobs that were permeated by bullshit. However, I’ve never worked an entirely bullshit job.
Or so I thought! Until I came to this interview with Pablo, a software developer:
Pablo: Basically, we have two kinds of jobs. One kind involves working on core technologies, solving hard and challenging problems, etc. The other one is taking a bunch of core technologies and applying some duct tape to make them work together. The former is generally seen as useful. The latter is often seen as less useful or even useless, but, in any case, much less gratifying than the first kind. The feeling is probably based on the observation that if core technologies were done properly, there would be little or no need for duct tape.
Wait a minute! That’s my job! Can it be? Is ops a bullshit job?
The duct taper
By “ops,” I designate a whole family of jobs that share the “taking a bunch of core technologies and… mak[ing] them work together” responsibility described by Pablo. These jobs have titles like System Administrator, Web Operations Engineer, Infrastructure Engineer, Performance Engineer, Site Reliability Engineer, Platform Engineer, and DevOps Engineer. Although these jobs vary in focus, they all carry this operational responsibility, which Graeber takes as evidence that these are duct taper jobs.
A “duct taper” is a role that only exists to solve a problem that ought not to exist in the first place. Graeber cites many examples:
- “I worked as a programmer for a travel company. Some poor person’s job was to receive updated plane timetables via email several times a week and copy them by hand into Excel.”
- “My job was to transfer information about the state’s oil wells into a different set of notebooks than they were currently in.”
- “My day consisted of photocopying veterans’ health records for seven and a half hours a day. Workers were told time and again that it was too costly to buy the machines for digitizing.”
- “I was given one responsibility: watching an in-box that received emails in a certain form from employees in the company asking for tech help, and copy and paste it into a different form.”
These are all very clear cases. But if ops is one of these duct taper jobs, then what’s the corresponding “problem that ought not to exist in the first place?” According to Pablo, it’s the fact that open source technologies are “unfinished,” “lacking quality,” and have “a lot of rough edges.” If, instead, companies were working with finished, high-quality components, then there would be no need for the duct tapers. So the theory goes.
On what grounds can we object to this characterization? Certainly not on the grounds that open source software doesn’t have rough edges. It most certainly does. One could perhaps take issue with the idea that if the core technologies underlying our software stacks were built with paid labor rather than unpaid labor, they’d be more “finished.” But I won’t.
Instead, I want to take aim at a misconception that I think Pablo shares with many, many people in the software industry. Namely, the idea that if a software system is built correctly, it will work. Or, equivalently: if a software system doesn’t work, then it wasn’t built correctly.
Why ops is necessary
If you work in ops, you no doubt recognize this attitude. It’s been described in countless aspects, from the venerable old “throwing releases over the wall” metaphor to the shiny new Platform Engineering book (Fournier & Nowland, 2024):
Operational discipline, by which we mean a focus on carrying out operational practices on a routine basis, is an area that it’s easy for those with an application software development background to overlook (or worse, roll their eyes at). Some folks think the only reason people have to focus so hard on operational practices is that they didn’t build their APIs right in the first place.
… [I]t is difficult to operate a system whose major functionality predominantly comes from someone else’s code – be it an OSS or vendor system, or some other in-house system. This adds a level of complexity in that unknown operational problems (the “unknown unknowns”) are a constant threat, and the only way to manage that threat is with a discipline that seeks to understand and address all anomalies early, before they cause acute pain.
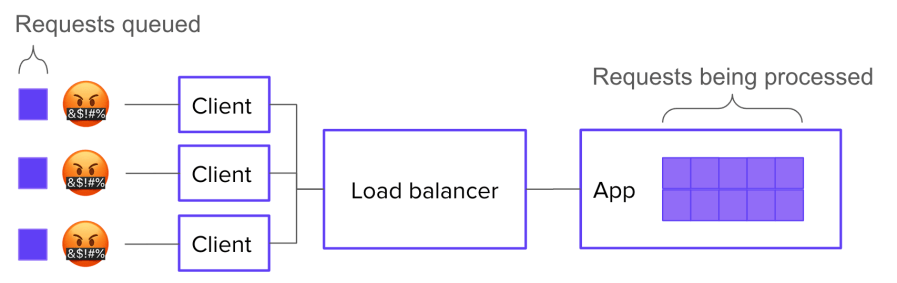
As soon as software leaves the realm of pure abstraction and enters into the service of real-world needs, it ceases to be “just software.” It becomes part of a complex system: one that includes third party platforms, multi-tenant networks, customers, adversaries, laws, and macroeconomic phenomena. The question of whether the software is built correctly may be the overriding consideration in the mind of a software developer, but it’s only a small matter compared to the myriad sociotechnical forces that determine a production system’s behavior.
Ops, in all its forms, seeks to address the challenges brought on by software’s transition from pure abstraction to engine of value. While software developers like Pablo see these challenges as incidental and indicative of shortcomings in the core technologies, they are in fact fundamental and irreducible. They’re a consequence of the ever-present gulf between the developer’s theory and the messy complexity of the world.
Operations entails constant negotiation between these two spheres: the abstract sphere of software, and the much larger, more complex sociotechnical sphere. This negotiation takes many forms:
- Reorganizing the connections between subsystems
- Probing the system for unexpected failure modes
- Building telemetry to monitor the system’s behavior
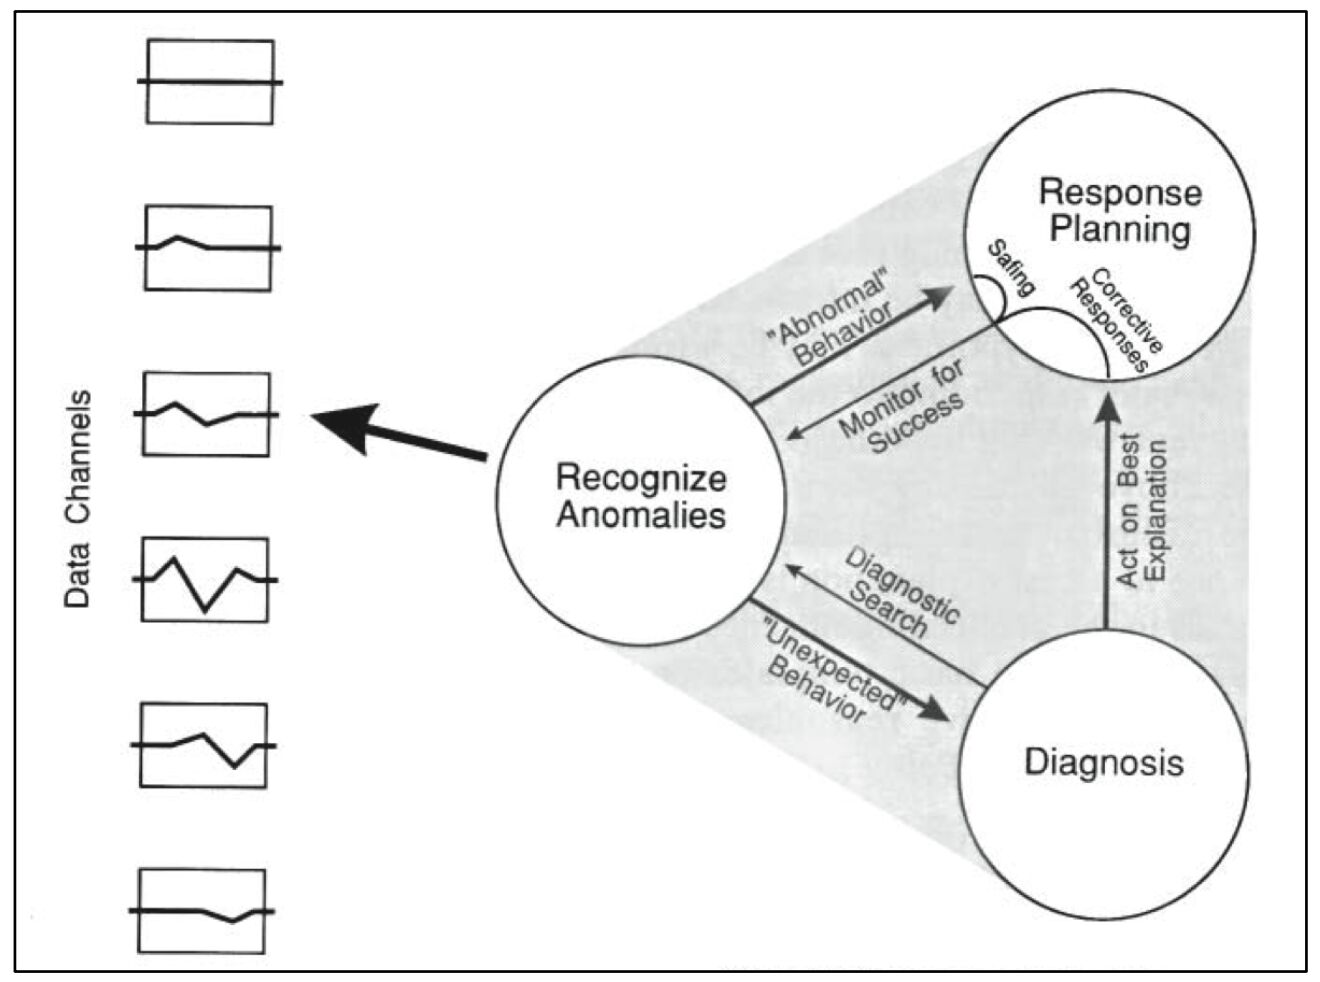
- Identifying anomalies and interpreting them
- Recovering from system failures
- Learning from system failures in order to improve reliability
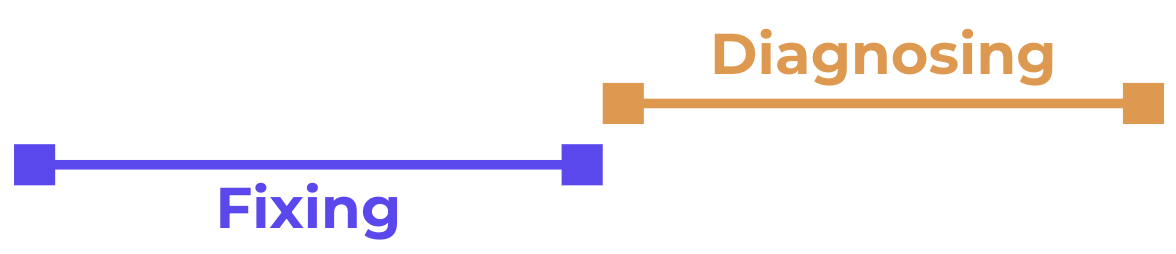
Much of this activity looks, to an outside observer, like fixing mistakes in the design of the infrastructure. But that’s only because, when discrepancies between software assumptions and real-world behavior inevitably accumulate, they tend to accumulate along boundaries with the outside world. Which is where ops happens.
Bullshit can take many forms
Now, do I claim that ops jobs are never bullshit jobs? Of course not. There are many ways for an ops job to be partly or entirely bullshit:
- You can be bad at the job, so that your work produces no value.
- You can be lazy, and survive by camouflaging your low output against the natural ineffectiveness of a large hierarchical organization.
- You can be effective at the job, but work for a company that produces no value.
- You can work on a product that doesn’t have enough traffic to cause significant operational problems.
- You can get roped into a compliance role.
- Your work can be so constrained by bureaucratic box-ticking that it loses meaning.
- You can just feel, in your soul, for reasons you can’t articulate, that your job is bullshit.
But most of these circumstances can apply just as easily to software dev jobs.
Only you can decide whether and to what extent you have a bullshit job. To do this, you must critically evaluate your work, the context of your work, and your feelings about your work. It’s a worthwhile exercise, regardless of where it leads.
Maybe your job is bullshit, maybe not. Just don’t take Pablo’s word for it.